Home Prices Increased 5% in November Amid Rapid Decline in Number of Homes For Sale

Affordable metro areas again saw the biggest home price gains in November. For the fifth month in a row, the nine metro areas with the biggest gains all had median sale prices below the national median, led in November by Camden, NJ (median price $200,000, up 14.3%), Detroit ($140,000, +12.0%) and Bakersfield, CA ($249,999, +11.6%). For the first time in five months, the metro area with the 10th-largest price gains in the nation was one with a median price above the national median: Salt Lake City ($345,000, +9.5%).

For the second month in a row, just one of the 85 largest metro areas Redfin tracks saw a year-over-year decline in the median sale price in November: San Jose, where home prices fell 1.1%. In San Jose, prices were still just barely rising a year ago, up 1.6%.

1 Like

Median Sale Price

Redfin Metro Median Sale Price Month-Over-Month Year-Over-Year
Albany, NY $224,500 4.4% 6.1%
Allentown, PA $210,000 -2.0% 7.7%
Anaheim, CA $720,000 1.4% 2.9%
Atlanta, GA $246,000 0.4% 5.6%
Austin, TX $308,900 -5.0% 3.0%
Bakersfield, CA $250,000 2.0% 11.6%
Baltimore, MD $275,000 -1.4% 4.8%
Baton Rouge, LA $199,900 -4.8% 0.0%
Birmingham, AL $210,000 5.0% 7.7%
Boston, MA $490,000 1.0% 3.2%
Bridgeport, CT $380,000 8.6% 2.7%
Buffalo, NY $159,000 -1.9% 5.0%
Camden, NJ $200,000 2.6% 14.3%
Charlotte, NC $258,000 0.4% 7.0%
Chicago, IL $241,000 0.0% 2.6%
Cincinnati, OH $182,000 1.1% 5.2%
Cleveland, OH $150,000 -4.5% 4.9%
Columbus, OH $210,100 -2.3% 7.7%
Dallas, TX $295,100 0.0% 2.8%
Dayton, OH $140,000 0.1% 8.2%
Denver, CO $415,500 -0.2% 5.2%
Detroit, MI $140,000 0.0% 12.0%
El Paso, TX $170,000 3.0% 9.2%
Elgin, IL $231,000 0.7% 6.9%
Fort Lauderdale, FL $277,000 0.7% 6.5%
Fort Worth, TX $247,100 -1.2% 7.6%
Frederick, MD $420,000 2.9% 5.2%
Fresno, CA $288,800 4.0% 9.4%
Grand Rapids, MI $207,500 -0.1% 8.9%
Greensboro, NC $179,800 -0.1% 2.7%
Greenville, SC $216,000 -0.5% 7.6%
Hartford, CT $221,000 -0.8% 4.2%
Houston, TX $243,000 1.2% 3.4%
Indianapolis, IN $185,900 -2.1% 6.2%
Jacksonville, FL $233,600 -1.3% 3.8%
Kansas City, MO $220,000 0.5% 2.4%
Knoxville, TN $217,200 2.0% 7.0%
Lake County, IL $230,900 0.8% 10.2%
Las Vegas, NV $289,000 -0.3% 4.0%
Los Angeles, CA $639,000 -0.5% 2.2%
Louisville, KY $190,000 -2.6% 2.7%
McAllen, TX $160,000 -3.0% 6.7%
Memphis, TN $179,000 0.6% 2.3%
Miami, FL $315,000 1.6% 8.6%
Milwaukee, WI $219,000 -0.5% 9.5%
Minneapolis, MN $280,000 0.0% 4.5%
Montgomery County, PA $320,000 1.6% 4.2%
Nashville, TN $306,500 2.2% 8.1%
Nassau County, NY $457,000 -0.7% 5.1%
New Brunswick, NJ $331,400 1.1% 6.9%
New Haven, CT $212,200 -1.3% 7.2%
New Orleans, LA $234,500 5.2% 9.1%
New York, NY $500,000 0.0% 0.0%
Newark, NJ $360,000 2.9% 6.4%
North Port, FL $280,000 3.7% 2.9%
Oakland, CA $720,000 -3.9% 0.7%
Oklahoma City, OK $184,000 2.2% 11.5%
Omaha, NE $210,000 -2.3% 6.0%
Orlando, FL $255,000 0.0% 3.9%
Oxnard, CA $610,000 -0.8% 4.5%
Philadelphia, PA $218,900 6.8% 10.0%
Phoenix, AZ $285,000 -0.3% 7.5%
Pittsburgh, PA $178,500 5.0% 11.6%
Portland, OR $410,000 1.2% 6.5%
Providence, RI $296,000 2.1% 9.6%
Raleigh, NC $292,800 0.2% 2.7%
Richmond, VA $255,000 -0.8% 4.1%
Riverside, CA $379,000 -1.6% 5.3%
Rochester, NY $150,000 -3.2% 6.7%
Sacramento, CA $413,000 0.7% 5.9%
Salt Lake City, UT $345,000 0.9% 9.5%
San Antonio, TX $225,200 -3.3% 0.1%
San Diego, CA $600,000 1.9% 7.1%
San Francisco, CA $1,375,000 -3.2% 2.9%
San Jose, CA $1,081,500 1.1% -1.1%
Seattle, WA $557,000 -0.5% 1.3%
St. Louis, MO $182,500 -2.1% 4.3%
Tacoma, WA $375,000 1.4% 7.5%
Tampa, FL $238,000 1.3% 4.4%
Tucson, AZ $225,000 -3.4% 3.4%
Tulsa, OK $170,000 -2.6% 0.0%
Honolulu, HI $575,000 -3.1% 0.0%
Virginia Beach, VA $233,000 -0.8% 3.6%
Warren, MI $214,200 -1.4% 7.1%
Washington, DC $414,700 1.1% 6.3%
West Palm Beach, FL $292,000 3.9% 10.0%
Worcester, MA $275,000 -1.7% 5.8%
National $311,600 0.0% 5.2%

Looks like Sacramento at 5.9% growth is performing better than Austin’s 3.0%, which is virtually the same as SF’s 2.9%. What’s the myth that Austin is growing gangbuster?

This is not good. Usually blue chip i.e. Fortress move up first.

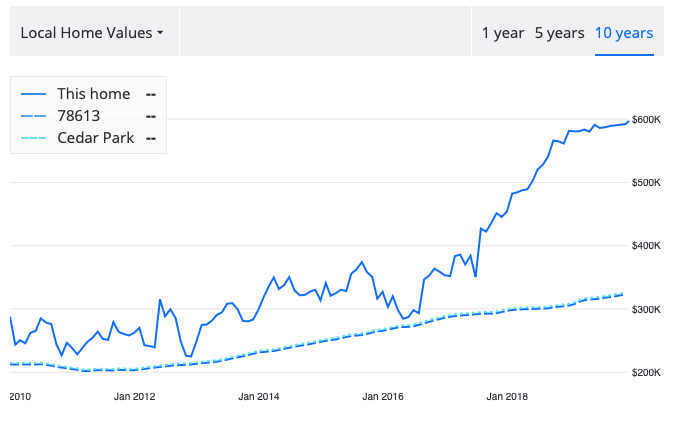
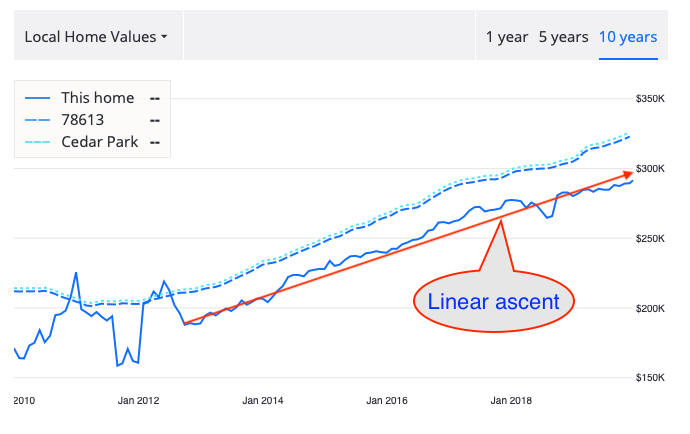
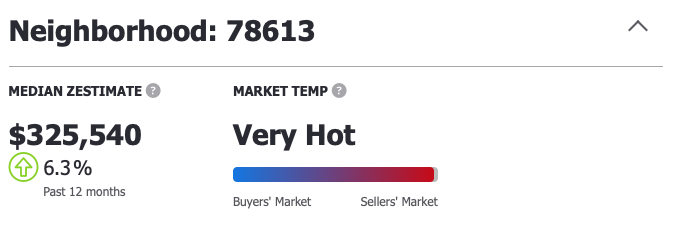
Author is referring to Austin proper. However, NW Austin and suburbs especially 78717 (Avery Ranch) and 78613 (Cedar Park) are very hot. Both have appreciation higher than 2.9% of Austin proper.

Btw, I don’t track Austin proper so I am clueless about the market trend there. @manch has short memory. Told him that so many times, how many more times I have to repeat myself.


2

Look like down trend to you?
1

85452aadbe91901fd5daf2db9356204aa3e7de5c