and you are trying to justify everything over fundamentals… when something goes up that much year over year, it just can’t be fundamentals, right?
Check this:
https://www.zillow.com/manhattan-new-york-ny/home-values/
check year over year. I don’t have much data to show you, but looking in parts of ny actually seem to show different stories.
Note: i know long term fundamentals are strong with population yada yada, but don’t justify every year prices going up 20% 
What fundamentals are being presented other than headlines that the sky is falling? Wow, a 0.7% yr-yr decline. The sky is falling. People expecting a 20%+ drop to buy are going to be sorely disappointed.
1 Like
that’s not me, just saying - i know you assume that i am waiting for it
did you see how your narrative changed? “Wow, a 0.7% yr-yr decline.” when it was about seasonality
Next year after people pay taxes(for 2018) in NYC and CA(other high cost states) it will be interesting to watch how the housing market behaves then.
1 Like
california was trying to pass the workaround for donating to some charitable thing and getting an 85% tax credit on it or something like that.
Gimmicks won’t work.
they had 5b$ cap or something stupid like that - like first 5b$ in donations would be counted. such a stupid workaround
If the first derivative of price is still positive, the second is pretty certain solid in negative territory by now.
I wish someone had compiled a city level pending/active ratio going back at least 20 years. Heard good things about this metric.
Nothing i know goes that far. maybe our kids will enjoy that data
first derivative is velocity
second is acceleration
third is jerk 
Maybe @SamShuehRealtor has data like that. He seems to be a collector of historical data.
Pending/active measures the absorption rate of inventory. It’s a leading indicator for price.
Last 5 years data in Cupertino show both up as well as down while the overall trend is up in that period. I’m trying to understand why can’t it be the same this year or maybe next year?
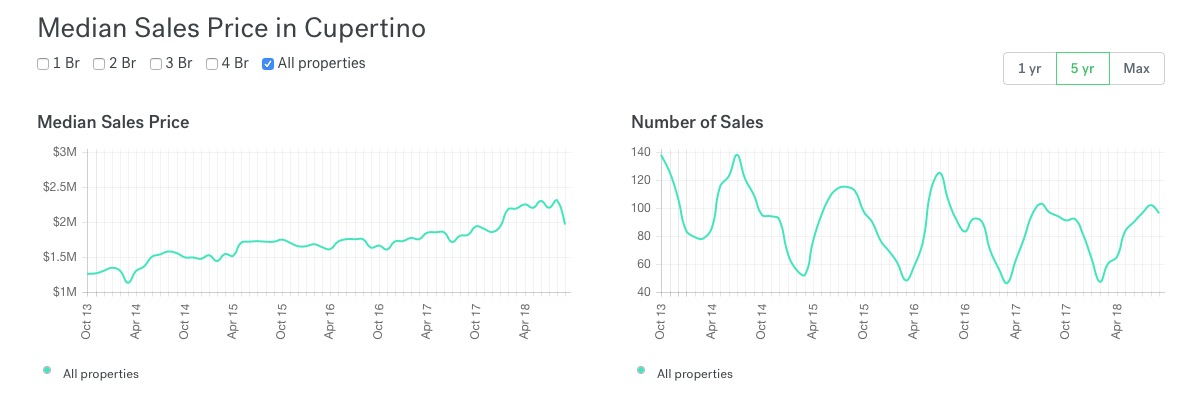
2016 is the only year that kind of resembles to this year in recent history.
With a special set up, I can pull data from 2000 and on 250 records at a time. Most realtors can pull data in mass from last 10 years only. Absorption rate is not something I use. I have not pulled data for SJ Mercury News for sometime. I then noticed the home price hit pre-2005 high a few years ago neighborhood by neighborhood. Right now, only remote neighborhoods like Gilroy, Morgan Hill are more active and sell well.
I went to MLS office across from Huawei looked through books from 1960s. Mayfair homes (Story) were selling more than Cupertino which was mostly blue collar then… Demographics all changed.
3 Likes
So what’s your read on current price trend @SamShuehRealtor? Do you think we are heading lower in high priced neighborhoods like Cupertino, Mountain View and the like?
Yes, 2016 was similar. Markets rocketed up after the elections. Uncertainty is over by then I guess.
@Roy321, I mentioned this earlier. My taxes will goi down in April because I get to deduct property tax for the first time after buying my house.
1 Like
how? isn’t the limit 10K or something, and there’s aMT?
There is no AMT this year for the first time for me. So I get to deduct SALT. Yes, it’s upto 10k but last year it was zero.
If you have not heard any layoffs we are probably OK in high tech neighborhoods. Few will want over bid 300-500K over as before though… The less desirable neighborhoods people are still overpaying (e.g. McLaughlin Ave, Story etc) so I expect some softening.
The Trade Tariffs will take a toll on builders ability to price new homes. Flooring, quartz, granite, lights, fixtures prices will go up very quickly according to CNBC. New homes will not have that much high grade to give away as standards. One needs to pay +10% or +25% more next year…
All the best,
Sam Shueh
3 Likes