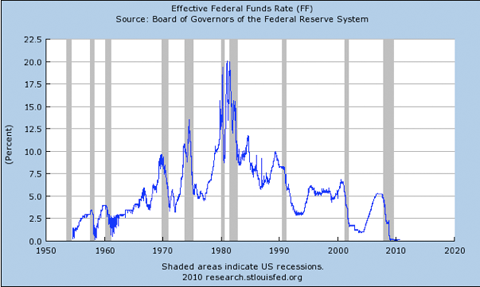
I saw a lot of talk on how to interpret Fed’s rate hikes. Some say recession or stock crash is imminent. Is it really that bad? Here’s the rate history in the years 1982-2000, the last great secular bull market that saw S&P500 rose almost 10x.
1982:
GDP = -1.9%,
Unemployment = 10.8%, Inflation = 3.8%
Apr
15.0%
Raised 3 points.
Dec
8.5%
Lowered nine times over nine months.
1983:
GDP = 4.6%,
Unemployment = 8.3%, Inflation = 3.8%
Aug
9.66%
Raised from May to August.
Oct
9.25%
Lowered from August to October
1984:
GDP = 7.3%,
Unemployment = 7.3%, Inflation = 3.9%
Aug
11.75%
Raised from March to August.
Dec
8.25%
Lowered from September to December.
1985:
GDP = 4.2%,
Unemployment = 7.0%, Inflation = 3.8%
Mar
9.0%
Raised from February to mid-March.
Dec
7.75%
Lowered from April to December.
1986:
GDP = 3.5%,
Unemployment = 6.6%, Inflation = 1.1%
Aug
5.66%
Lowered from March to August.
Dec
6.0%
1987:
GDP = 3.5%,
Unemployment = 5.7%, Inflation = 4.4%
Sep
7.25%
Raised rates from April to September.
Nov
6.75%
Lowered after October 19 stock market crash.
1988:
GDP = 4.2%,
Unemployment = 5.3%, Inflation = 4.4%
Feb
6.5%
Lowered in January and February.
Dec
9.75%
Raised rates to fight inflation.
1989:
GDP = 3.7%,
Unemployment = 5.4%, Inflation = 4.6%
Dec
8.25%
S&L crisis. Fed lowered rates.
1990:
GDP = 1.9%,
Unemployment = 6.3%, Inflation = 6.1%
Dec
7.0%
Recession began in July.
1991:
GDP = -0.1%,
Unemployment = 7.3%, Inflation = 3.1%
Dec
4.0%
Recession ended in March.
1992:
GDP = 3.6%,
Unemployment = 7.4%, Inflation = 2.9%
Apr 9
3.75%
Expansion.
Jul 2
3.25%
Sep 4
3.0%
Clinton took office in 1993. Fed made no changes.
1994:
GDP = 4.0%,
Unemployment = 5.5%, Inflation = 2.7%
Feb 4
3.25%
Mar 22
3.5%
Apr 18
3.75%
May 17
4.25%
Aug 16
4.75%
Nov 15
5.5%
Raised rates.
1995:
GDP = 2.7%,
Unemployment = 5.6%, Inflation = 2.5%
Feb 1
6.0%
Raised rates.
Jul 6
5.75%
Lowered rates.
Dec
5.5%
1996:
GDP = 3.8%,
Unemployment = 5.4%, Inflation = 3.3%
Jan 31
5.25%
Kept rates low despite inflation.
1997:
GDP = 4.5%,
Unemployment = 4.7%, Inflation = 1.7%
Mar 25
5.5%
1998:
GDP = 4.5%,
Unemployment = 6%, Inflation = 1.6%
Sep 29
5.25%
LTCM crisis.
Oct 15
5.0%
Nov
4.75%
1999:
GDP = 4.7%,
Unemployment = 6%, Inflation = 2.7%
Jun 30
5.0%
Raised rates
Aug 24
5.25%
Nov 16
5.5%
2000:
GDP = 4.1%,
Unemployment = 6%, Inflation = 3.4%
Feb 2
5.75%
Raised rates despite stock market decline in March.
That period was crazy with only 1 short Recession. Overall, rates were falling. I’m comparing rate increase required to trigger a recession. The market graph proves the market doesn’t always drop in a recession.
The swings were super wild back then. From feb to dec of 1988 the Fed raised rate by 3.25%! No reaction from the stock market as far as I can tell.
Back test your hypothesis how market reacted to rate hikes and see how your system would have fared. For me I will just remain as long as I could and trim for money management purpose alone. React, rather than predict. Economy is super strong. It’s not just the US. The whole world is booming. Very rarely do we see synchronized boom time on a global scale.
Inflation has changed over time. They add/subtract items from a “typical consumer basket of goods”. Unemployment has been the same as far as I know. GDP should be the same too.
They supposedly modify it to keep it representative of what consumers are buying. I’m not sure if an iPhone is in it, but that didn’t exist 20 years ago. I think the list of items is on the BLS website.