Starting my own Price Reduction Index

Every week I’ll go to Redfin, look at the area between Millbrae and Palo Alto, and look at the ratio of price reductions to total houses for sale.

       Denominator: Houses only, max $2M sale price, active only
        Numerator:    Houses only, max $2M sale price, active only, price reduction

Right now: 9/194, or 4.6%. Interesting to see how this evolves

4 Likes

would be nice if you keep track of san jose too, i know a lot have been reduced and still unable to sell.

R&V housing index.

1 Like

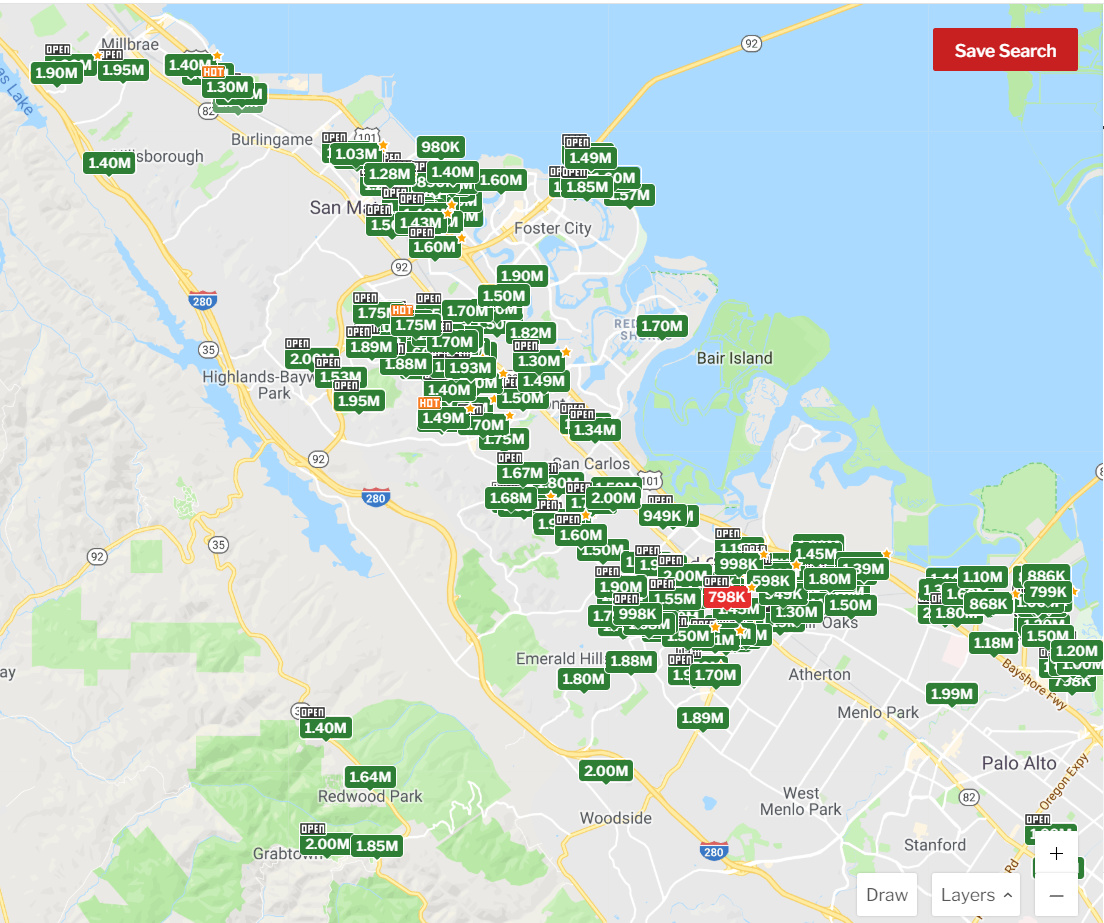
I don’t know if this is that meaningful since some listing agents like to list low to start bidding wars while others actually price at what they want to sell at

2 Likes

I feel like prices might start picking up soon.

Why?

Are you interested in buying in South Bay (or do you have property here)?
I noticed that you recently mentioned Cupertino and SJ a few times.
Aren’t you more interested in San Mateo County?

i’m more interested in millbrae,
but san jose has most inventory for sale, i think it will be a good indicator to other smaller cities what happens when inventory/price reduction starting to pile up.

1 Like

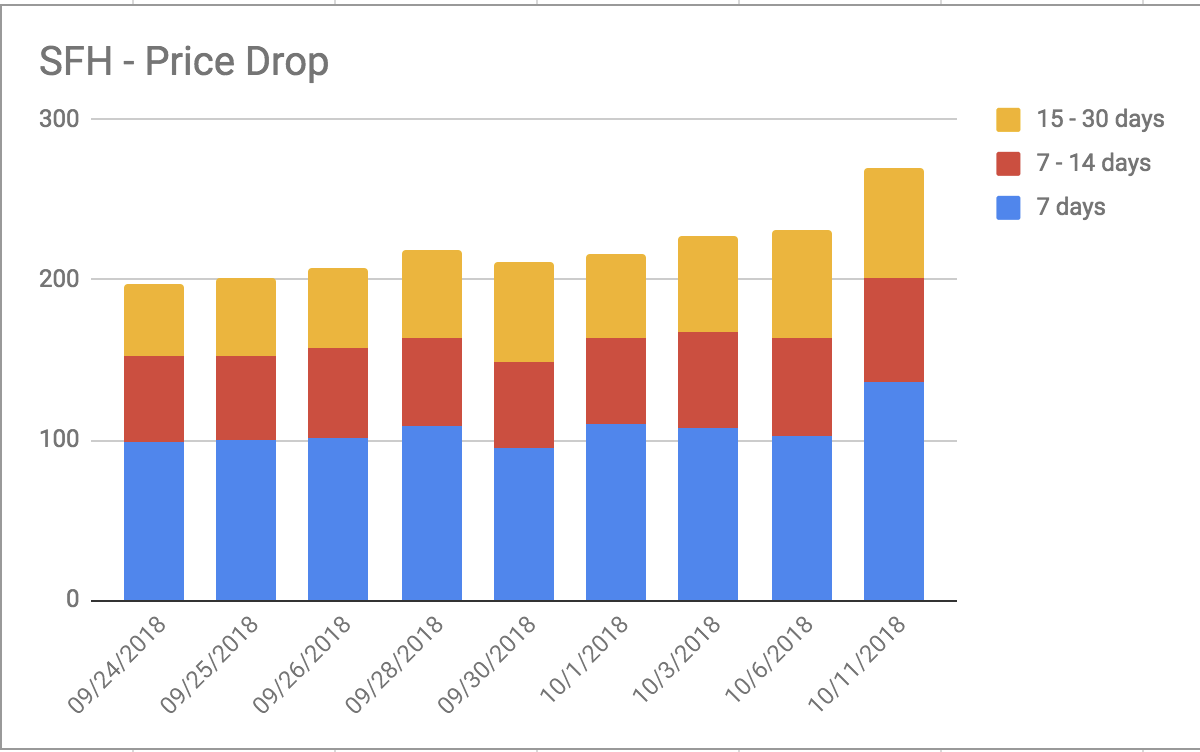
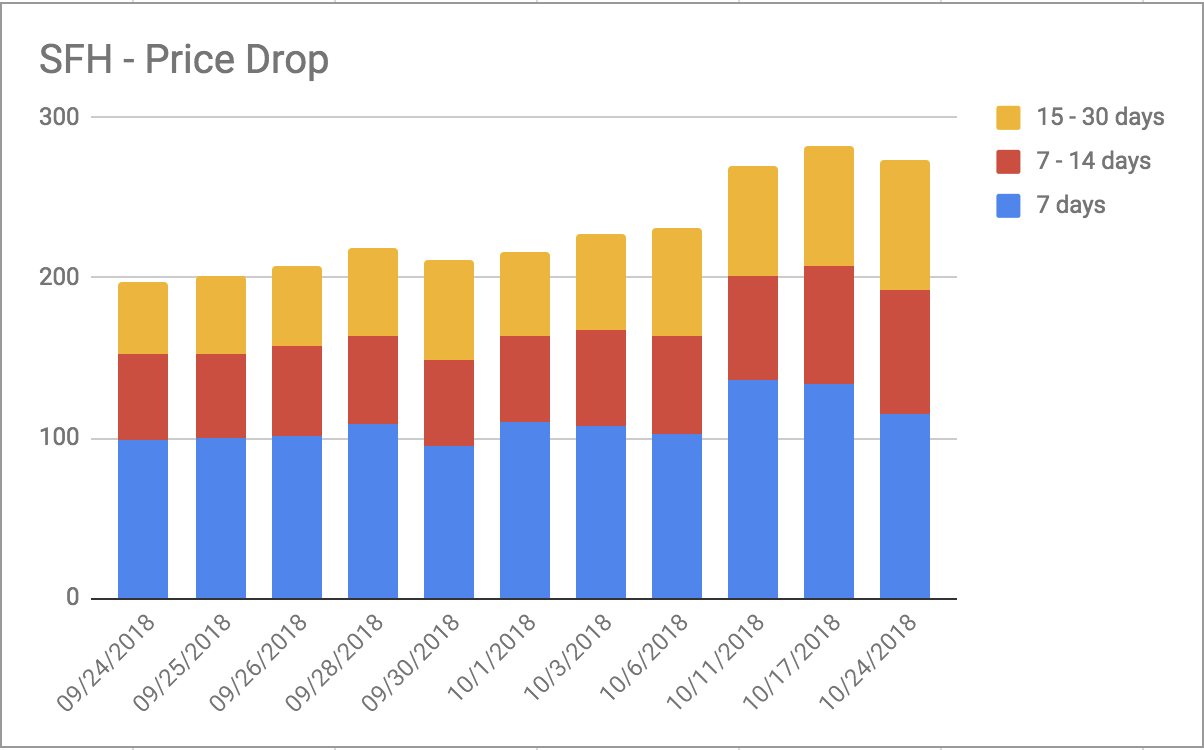
Here is what I have been tracking last few weeks. My take is it is okay to have the price drop for changing market condition, but as long as those got dropped in last 7 days went pending.

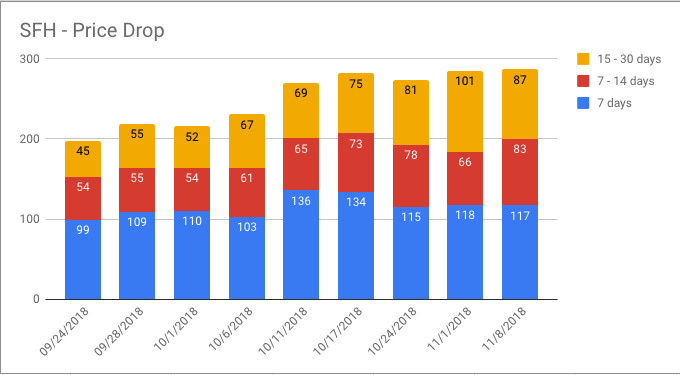
I’ll be worried if those dropped in 14 days or 30 days kept on increasing which means people stopped buying so far that doesn’t happened yet.

https://www.redfin.com/city/17420/CA/San-Jose/filter/dyos-shape-id=28253152,property-type=house,max-price=2.5M,max-price-reduced=1mo

7 days 7 - 14 days 15 - 30 days
09/24/2018 99 54 45
09/25/2018 100 53 48
09/26/2018 101 57 49
09/28/2018 109 55 55
09/30/2018 95 54 62
10/1/2018 110 54 52
10/3/2018 108 60 59
10/6/2018 103 61 67
10/11/2018 136 65 69

4 Likes

The areas I am watching felt like going faster a bit. I may be wrong, though, i haven’t been following as closely lately for the past month or so due to work.

Isn’t Milbrae more correlated to SF than SJ?
I guess buyer/seller pool is quite different between Milbrae and SJ.
However, I may be wrong, I don’t know much about Milbrae.

yup, but it’s still good data reference.

So what do you see what we are trending towards ?

Are houses selling within first 7 days of price reduction or still lingering on .

So far they went pending in good rate after the price drop, there are obviously some outlier making into 14 days period.

Weekly update: 8/199 = 4%

A bit delay update. Price deduction increased in week of 10/11 & 10/17 but it looks like market absorbed it most of them went pending.

7 days 7 - 14 days 15 - 30 days
09/24/2018 99 54 45
09/25/2018 100 53 48
09/26/2018 101 57 49
09/28/2018 109 55 55
09/30/2018 95 54 62
10/1/2018 110 54 52
10/3/2018 108 60 59
10/6/2018 103 61 67
10/11/2018 136 65 69
10/17/2018 134 73 75
10/24/2018 115 78 81

6 Likes

this is very nicely done. please keep updating! thank you

Could you add a column for price reductions > 30 days old? An increase in homes sitting even after a price reduction would indicate significant softening.

Added last 2 weeks data:

09%20PM

I started collecting that data last two weeks as well as total inventory, so we can do the ratio, but will add to the graph when we have enough data.

2 Likes

thanks!