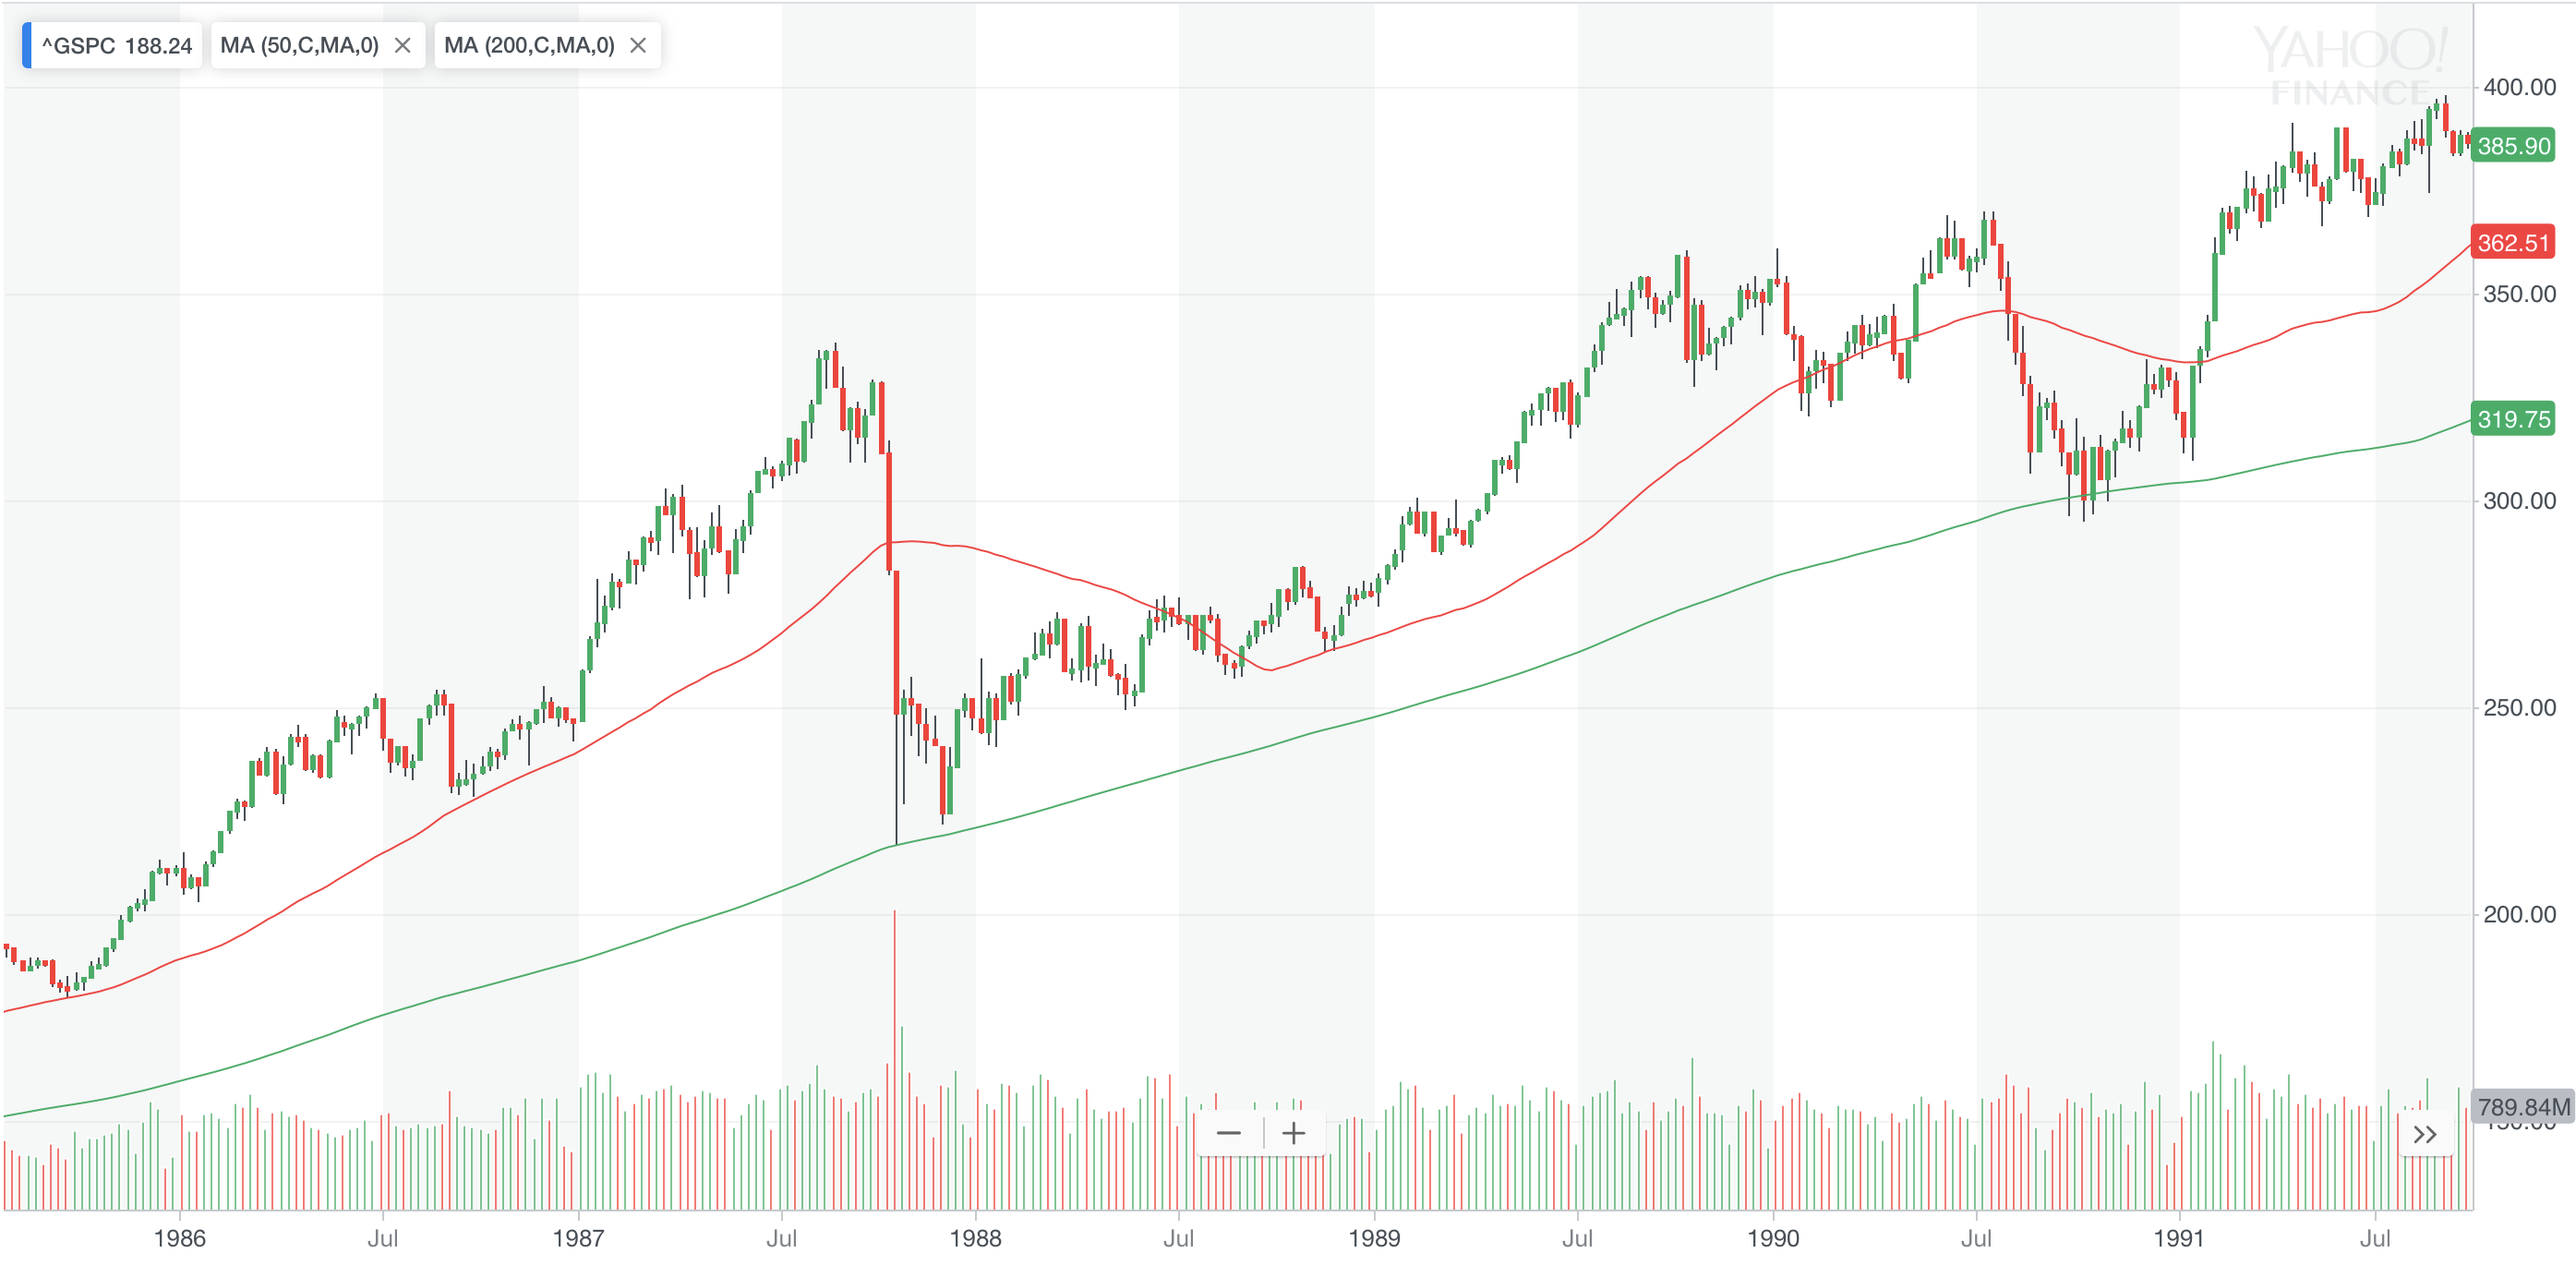
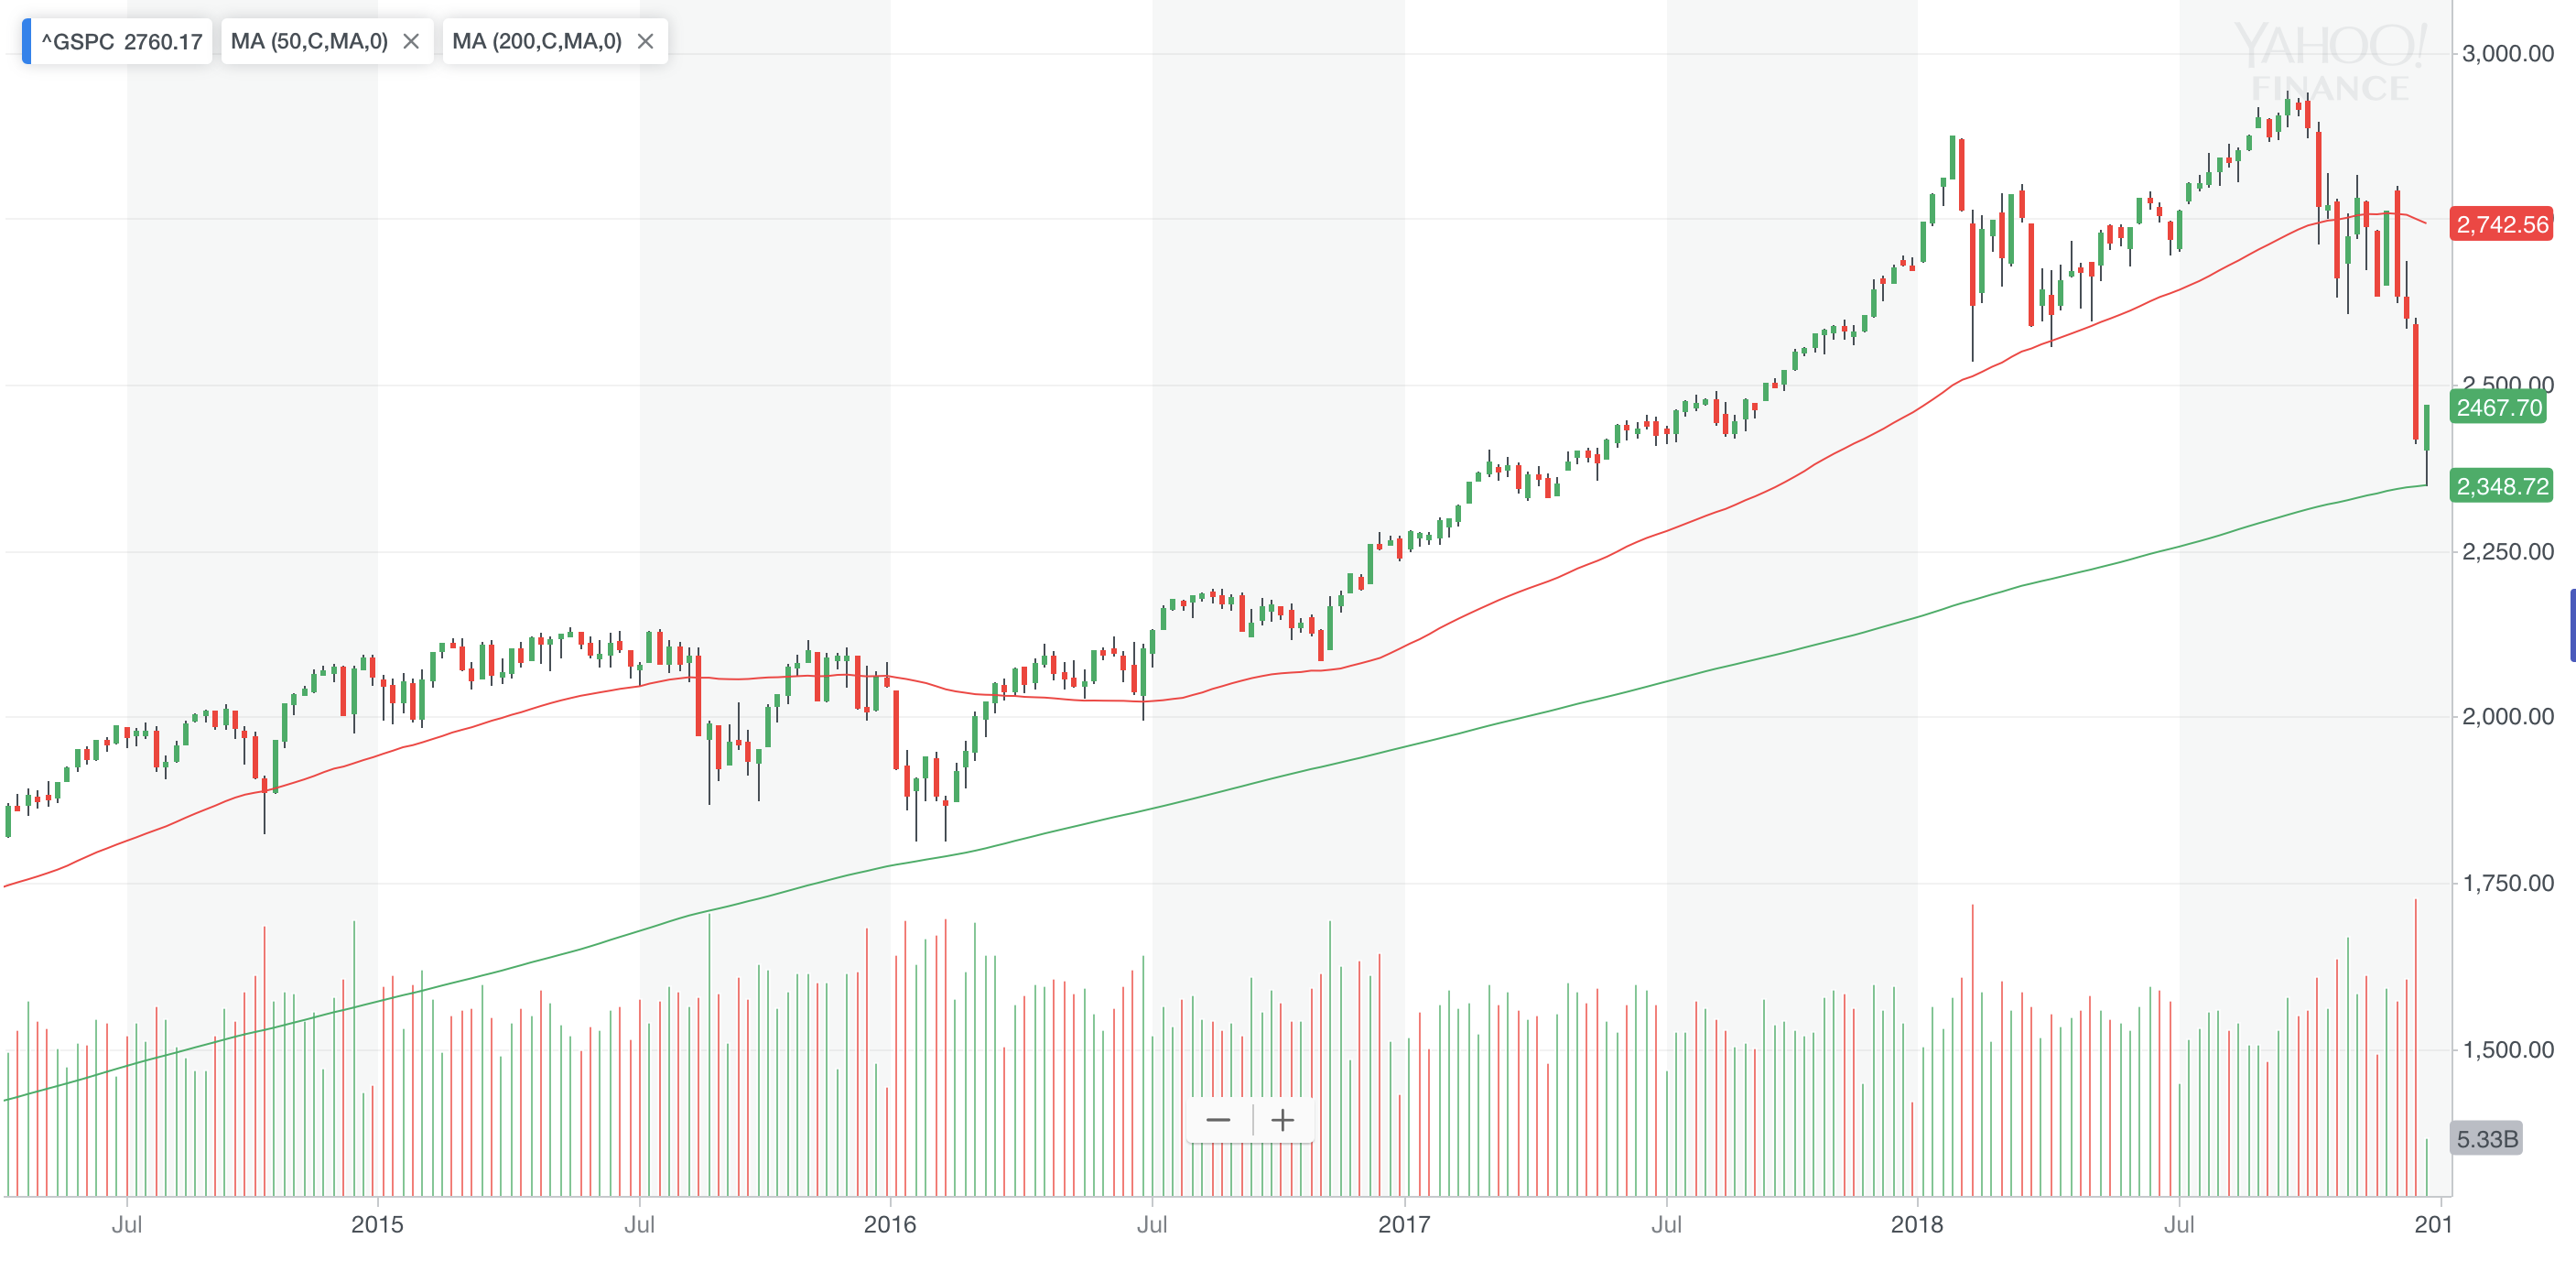
Both weekly charts. I didn’t know the 1987 bear was so long and so painful. It didn’t regain its former height until almost 2 years later, only to be clobbered yet again by the 1990-91 recession. Imagine you were in that market. Quite a few committed suicide.
The 200-week trend line proved to be pretty good both then and and I suspect for today as well.
You’re one day late. WQJ and JIL said it earlier which I predict earlier than both of them (Kangaroo Jump).
Ignore above statement is market continues to decline. Otherwise, praise ME!
Btw, you can interpret the correction has started since early 2018.
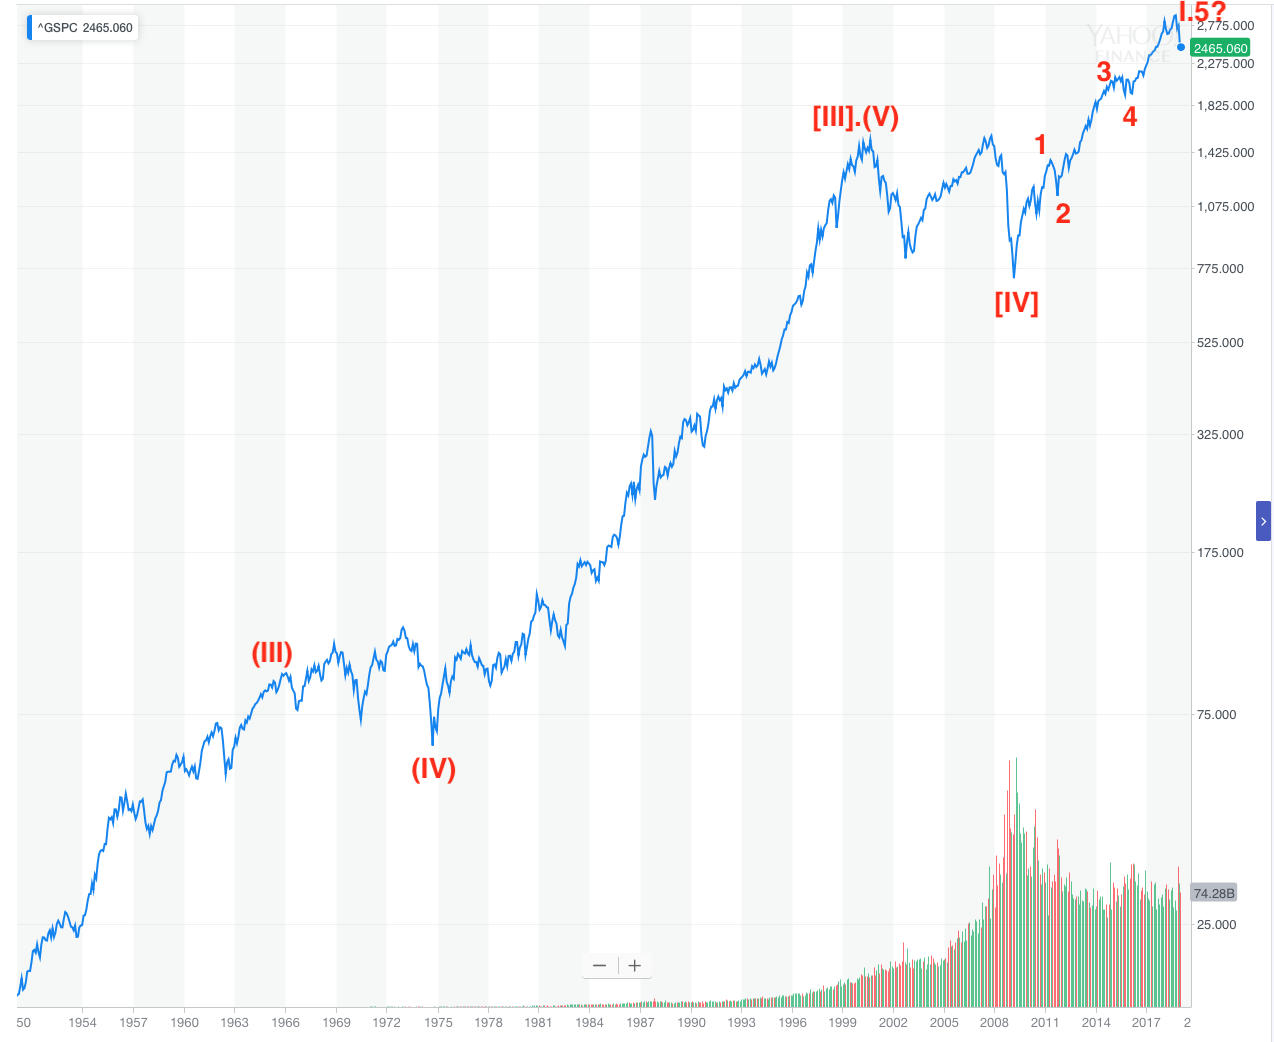
The 1982-2000 is the most powerful secular bull market of all time and I continue to believe we are in another one, starting from 2013. Secular bulls can have many bears within it, like 1987 and 2018. The slow grinding up will be very profitable if we managed to stay alive.
HELOC or re-finance your rentals. Load up shares You may have missed the 2008 financial crisis, this is another chance to make it big. Do or die! Take it, to achieve $5M per person in supersonic time.
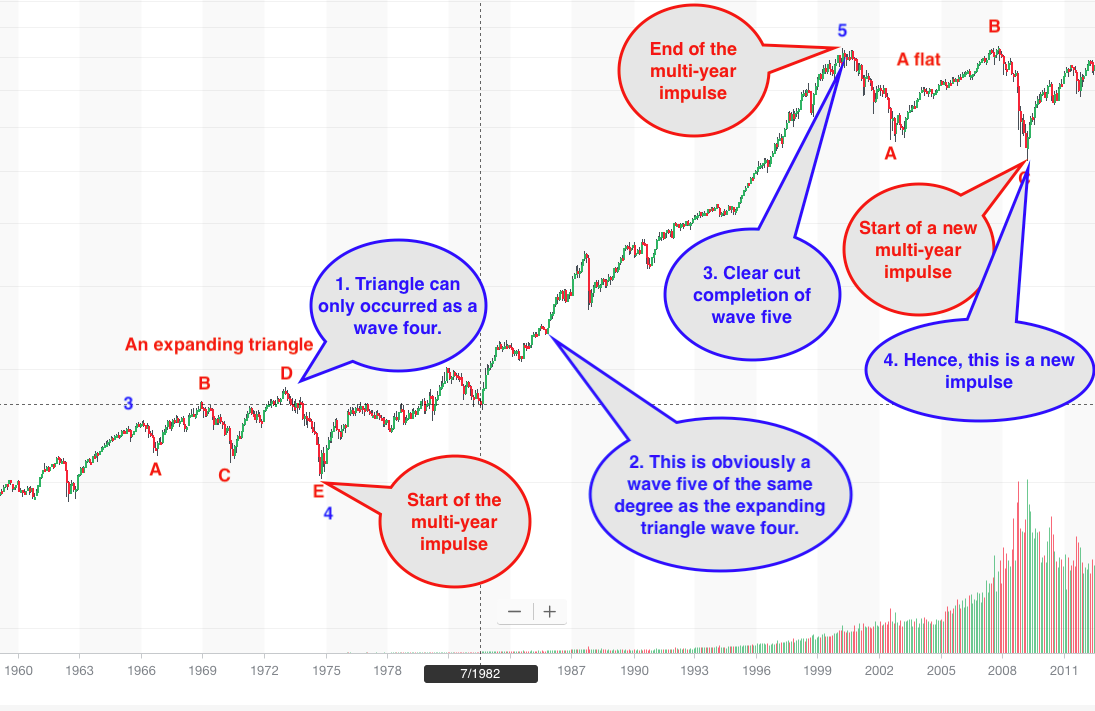
Multi-decade impulse started from 1975 and ended in 2000.
Flat corrective wave from 2000 to 2009.
New multi-decade impulse started from 2009 to …
Current decline in the grand scheme of things is SHALLOW.
You can not expect major changes repeatedly until dec 31st as there is lot of people to sell their loss so that they do not pay tax on gains. Selling pressures are high until dec 31st.
Thereafter results are coming and stocks likely go up until all qtrly updates are over. In between fluctuations are as usual.
There isn’t that much retail money in stock market. Most people’s exposure are limited to their 401k portfolio, which is mostly in index funds, and tax-free to begin with.
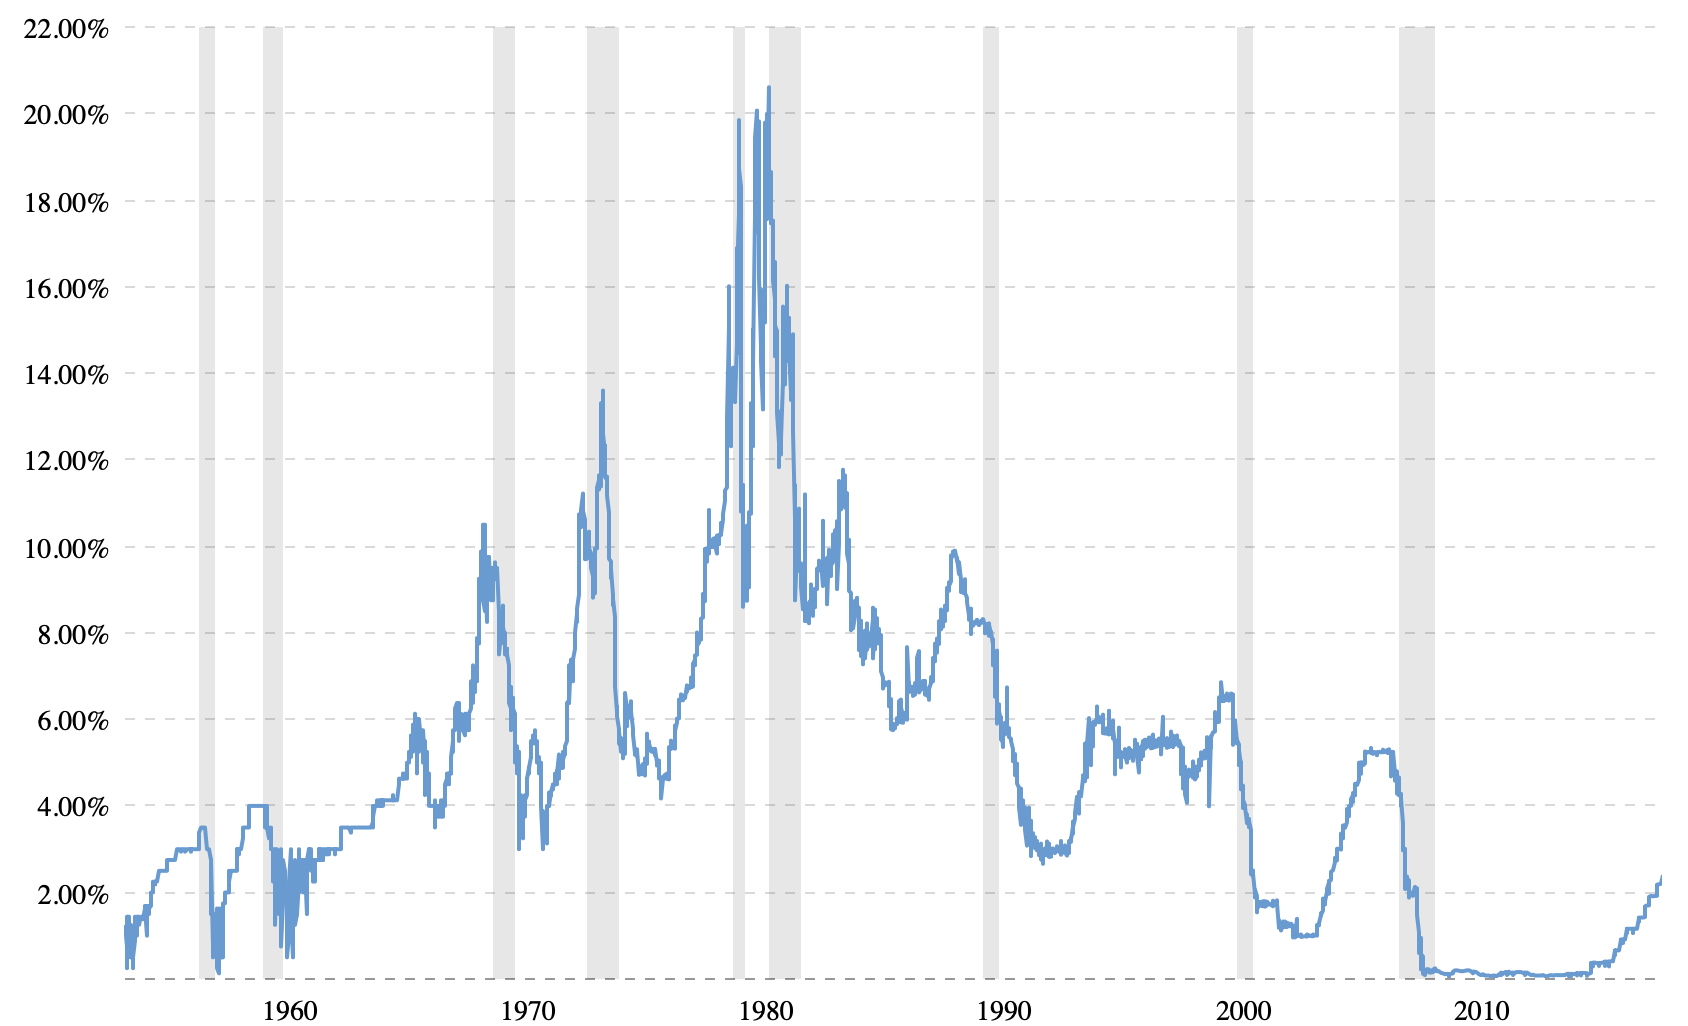
Rather, both interests rates and stock markets react to business cycles. They both react to some underlying causes of the business cycles. Correlation, not causation.
The absolute level of rates is still pretty darn low. Real rates is still close to zero. How can economy be growing at 3% real and not able to deal with a 0.5% real interests rate?