There’s an old personal finance rule of thumb called the 50/30/20 rule that states you should spend roughly 50% of your income on necessities (housing, transportation, healthcare and other bills), 30% of your income on wants (dining out, travel, entertainment, etc.) and 20% of your income on savings or paying off debt.
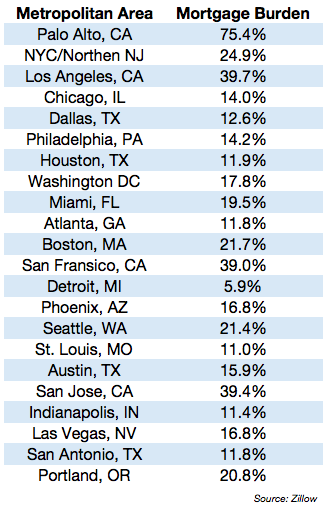
But the biggest chunk of your spending will typically go towards housing. And how much you spend on housing has as much to do with where you live than anything. Zillow recently released data on a number of different housing markets across the country and calculated what the mortgage burden (% of income spent) on housing looks like depending on the specific city or metropolitan area:
Those numbers don’t make sense to me.
Can you even get the mortgage if mortgage/income ratio is 75%?
I guess it should be less than 40% or something.
Did they use overly simplified formula like “80%_of_average_housing_price_of_PA / average_income_PA”?
If so, the number is meaningless.
It reflects more about the home price appreciation over decades for PA instead of the mortgage burden. Many long time owners have very little mortgage payment
It makes sense if you only look at ratio of median home price to median income. That’s not a great reflection though. People that bought years ago have a mortgage based on that purchase price (if they didn’t pullout equity). Current buyers have inkmces to afford current prices. It does show risk if a bunch if people in Palo Alto suddenly decide to sell. Are there enough people that can afford current prices to buy up the inventory?
If these numbers are drawn from after-tax income, it makes perfect sense to me. I know many folks who have to sell vesting RSUs each month just to get by (many of them senior folks too).
Base salary 200k nets you < 10,000 a month(single income, 1kid). The 39% (San Jose) * 10,000 = $3900 mortgage means 800k mortgage, so ~1M house, which is the bare minimum for anywhere with ok school(West San Jose, Fremont, Milpitas). So in this scenario, 39% is the absolute minimum. But those who pull in 200k base typically gets 100~200k bonus/RSU. So they shoot higher, and at least try Sunnyvale (Cherry Chase), Cambrian, San Carlos, etc which are all around 1.5M.
Are they over-stretched? I believe so, not because of the % of net income, but because they’re relying on RSU/bonus (which are volatile) to sustain. From 2012 till now, the housing prices doubled, but the tech salary has only increased about 10% max. So DTI has got to go up.
If this market were to sustain at this rate for few more years, I honestly don’t think it’s due to local tech jobs, but foreign (of Bay Area) flowing into the area.
It seems the whole article is about after tax income, given how they start with 50/30/20 of how you spend the take home salary. So, like I said, the numbers look sound, even by calculating the (PITI)/(take-home) individually, and taking the average/median of that distribution of numbers.