manch
1
Slight caveat: it counts the number of people born in India, not people of Indian heritage.
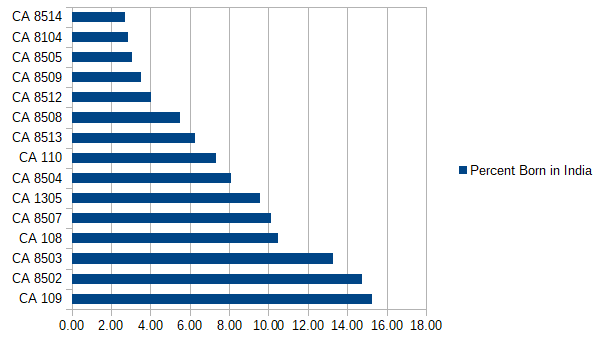
Descriptions for the PUMA numbers
- CA,8514,Santa Clara County (Central)–San Jose City (East Central/East Valley)
- CA,8104,San Mateo County (South & West)–San Mateo (South) & Half Moon Bay Cities
- CA,8505,Santa Clara County (North Central)–San Jose City (East Central) & Alum Rock
- CA,8509,Santa Clara County (Central)–San Jose City (Northwest)
- CA,8512,Santa Clara County (Central)–San Jose City (Southwest/Almaden Valley)
- CA,8508,Santa Clara County (Central)–San Jose (West Central) & Campbell Cities
- CA,8513,Santa Clara County (Central)–San Jose City (Southeast/Evergreen)
- CA,110,“Alameda County (East)–Livermore, Pleasanton & Dublin Cities”
- CA,8504,Santa Clara County (North Central)–Milpitas & San Jose (Northeast) Cities
- CA,1305,Contra Costa County (South)–San Ramon City & Danville Town
- CA,8507,“Santa Clara County (Southwest)–Cupertino, Saratoga Cities & Los Gatos Town”
- CA,108,“Alameda County (Southwest)–Union City, Newark & Fremont (West) Cities”
- CA,8503,Santa Clara County (Northwest)–San Jose (Northwest) & Santa Clara Cities
- CA,8502,Santa Clara County (Northwest)–Sunnyvale & San Jose (North) Cities
- CA,109,Alameda County (South Central)–Fremont City (East)
manch
2
The opposite, places with the smallest number of people born in India:
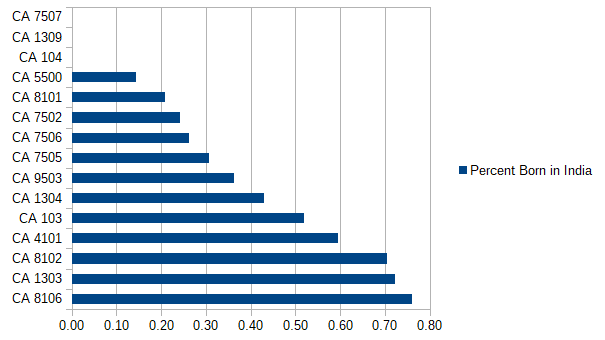
Descriptions for the PUMA numbers
- CA,7507,San Francisco County (South Central)–Bayview & Hunters Point
- CA,1309,Contra Costa County (East)–Brentwood & Oakley Cities
- CA,104,Alameda County (North Central)–Oakland City (South Central)
- CA,5500,Napa County–Napa City
- CA,8101,“San Mateo County (North Central)–Daly City, Pacifica Cities & Colma Town”
- CA,7502,San Francisco County (North & East)–North Beach & Chinatown
- CA,7506,San Francisco County (South Central)–Sunset District (South)
- CA,7505,San Francisco County (Central)–Sunset District (North)
- CA,9503,Solano County (Northeast)–Vacaville & Dixon Cities
- CA,1304,“Contra Costa County–Walnut Creek (West), Lafayette, Orinda Cities & Moraga Town”
- CA,103,Alameda County (Northeast)–Oakland (East) & Piedmont Cities
- CA,4101,Marin County (North & West)–Novato & San Rafael (North) Cities
- CA,8102,“San Mateo County (North Central)–South San Francisco, San Bruno & Brisbane Cities”
- CA,1303,“Contra Costa County (Northwest)–Concord (West), Martinez & Pleasant Hill Cities”
- CA,8106,“San Mateo County (Southeast)–Menlo Park, East Palo Alto Cities & Atherton Town”
1 Like
calboy
3
Good one dude!! Got same stuff for Filipino, chinese and hispanics? Post it away
ww13
4
Check the elementary school makeup. In the mission district of Fremont it’s a super majority. Make that a super super majority.
manch
5
Mission is in CA 109 right?
ww13
6
I would think so. I didn’t examine the quality of this source closely, but take a look at the elementary age cohort.
https://statisticalatlas.com/neighborhood/California/Fremont/Mission-San-Jose/Race-and-Ethnicity
They don’t break out SEA vs SA, but it’s mainly SA.