So looking at it from the total class size, Lowell is the best. 11% of the kids got into Berkeley. Lynbrook at 8.2% looks much better. But my point is that ranking in the top 8% of Lynbrook or MSJ is incredibly difficult.
One more thought on parents’ role in college admission. My feeling is that college admission is getting increasingly “unfair”, in the sense that it is no longer a simple “you work hard and you get into a good college” linear relationship.
The trend to get rid of standardized tests is a really bad idea IMO. There is no longer a simple metric. Instead parents have to hire expensive consultants to navigate the ever more confusing system. In the end it actually hurts the lower income families because they don’t have all these expensive resources to make sense of it all. This is especially true for immigrant families whose parents didn’t go to high school here.
The worst thing is to tell kids you will be alright if you work hard, only to have it not being true. Parents need to get more involved in giving our kids the tools to make it. Choosing the right K-12 schools is a big part of it.
Maybe Congress needs to take action here. “Sensitive content.” And you need to protect yourself. At least have forum entrants self-certify that they are over the age of…19?
Obsession with wealth and social status. Maybe as bad as violence or porn?
Come to think about it, yes, this site is definitely harmful to kids. We have people regularly flaunting their wealth here. Some people saying women should not be educated. All sorts of weirdos.
I think what is increasing more so is the thought that there are only so many “good” schools and now everyone wants to get into only those. This is why it’s also getting harder = more applicants to top schools / less % acceptance rates. Too many people thinking they have to go to a UC or Stanford, etc.
Before pandemic lynbrook number was like 15%sh. It certainly dropped a lot since they removed SAT/ACT scores.
I am glad my kid finished college admission before pandemic.
I looked at the 2016 stats, Lynbrook had 72 students admitted to Berkeley in 2016, versus 40 in 2022, a 44% drop. Monta Vista 57% drop. Paly 41% drop. Pretty much the Asian-heavy schools in South Bay all saw huge drop.
How should I assess college admission rate for Seattle area high schools? I can’t find college admission data on HS website. What would be good representative colleges to check?
I got all my data from UC’s website. UC opened up their admission data because of a lawsuit if I remember correctly. Colleges don’t want the public to know how the sausages are made for obvious reasons.
For Washington state the flag ship public school is UW Seattle. I did a brief Google search and didn’t see any data available. Not sure how you can replicate my study over there. UW is famous for being impossible to change into CS major. You have to be admitted into the CS department as freshman. I think UIUC is also like that.
These schools want to accept more socially-disadvantaged students, so admissions from other schools will be lower. The average quality of the students will be lower but that’s what they are willing to accept. Eliminating standardized tests is simply a way to not have to explain how they do that. Goal is already set so how to get there is just a technicality.
I wonder if and how long it will take to affect the local real estate market? People pay a huge premium for Palo Alto and Cupertino homes because “schools are better”. But now it seems it will actually hurt a kid’s chance of getting into the top UC schools. Will people still want to pay that premium?
Lawmakers approved a unique implementation of the law for UT Austin under Senate Bill 175 passed in May 2009. Under this law, 75 percent of the first-year in-state students must be automatically admitted. The law requires the university set the threshold for automatic admission on an annual basis to meet these requirements, with the decision being announced each fall for students entering their junior year of high school.
Currently, The University of Texas at Austin automatically admits eligible Texas students in the top 6% of their high school graduating class beginning in the summer and fall of 2022.
This is the same automatic admission threshold in use for the summer and fall of 2021 and spring of 2022.
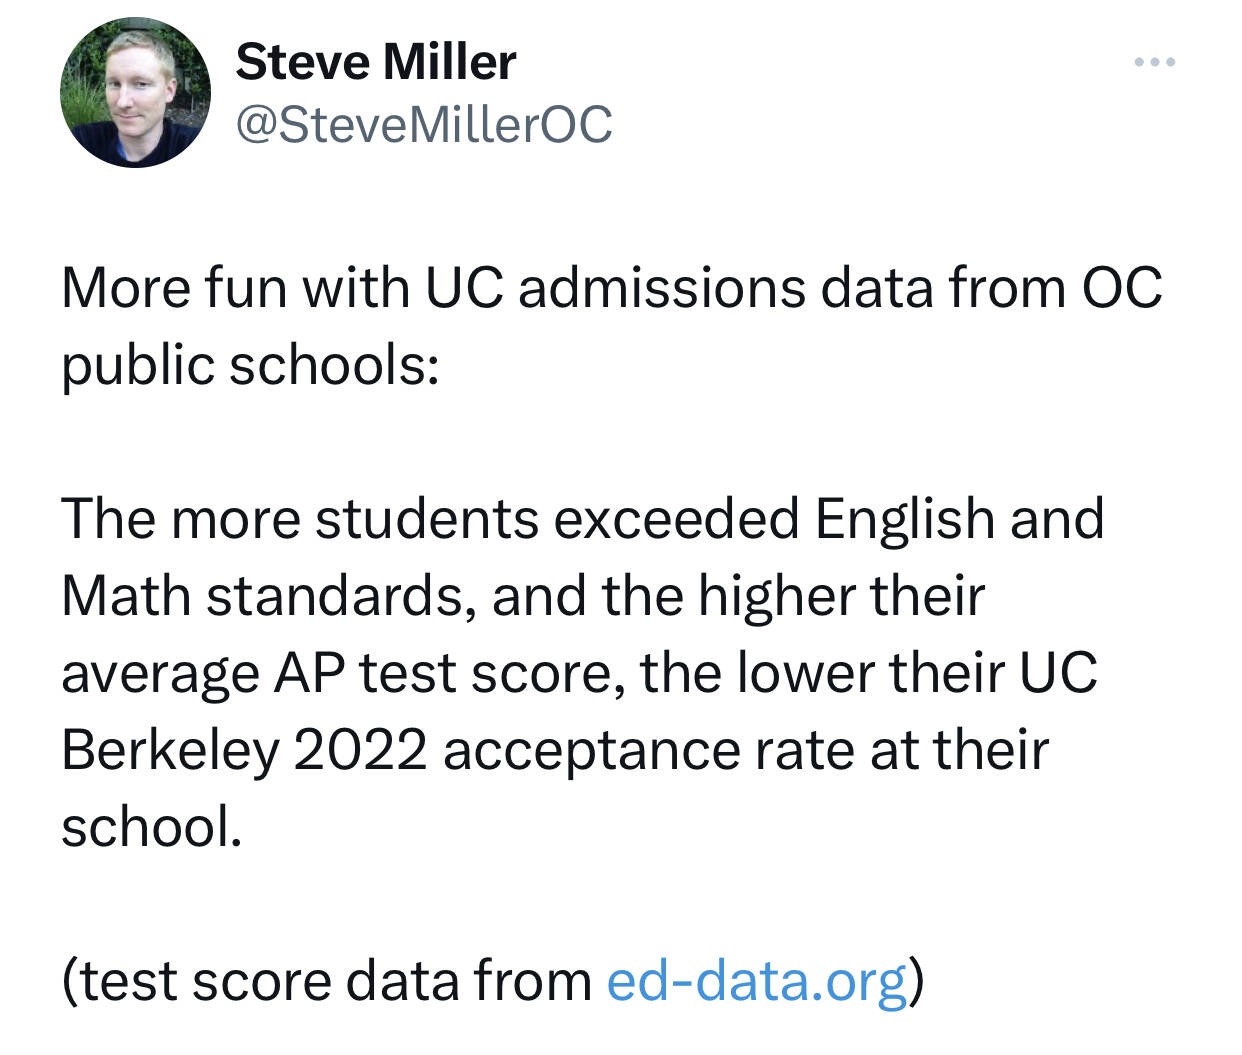
Acceptance rate changes over the years. For some reason UCLA and UC Davis didn’t see much change. And the changes seem to predate the test blind policy.