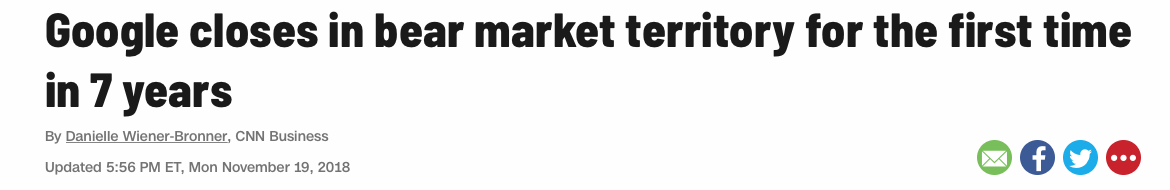
Below article appears 3 days after I posted? Also GOOG already in bear territory before today.
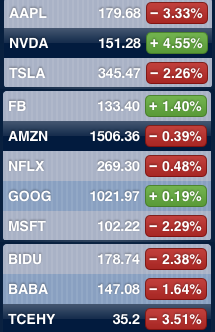
What’s msft doing in that list?
Everybody talk about this old fart, so I included in the list. There are many hedge fund managers who are old farts, they love to hype MSFT, INTC, CSCO, ORCL, IBM, GE and GM.
While blogging, even more stocks reverse.
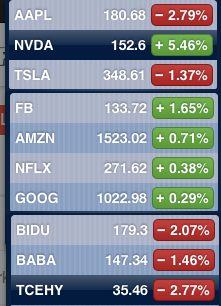
So blog more? 
1 Like
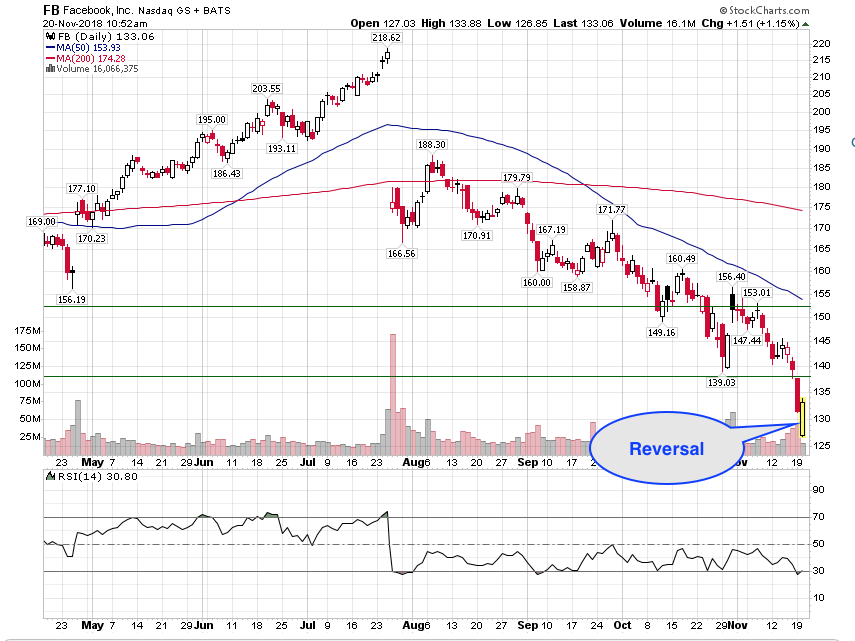
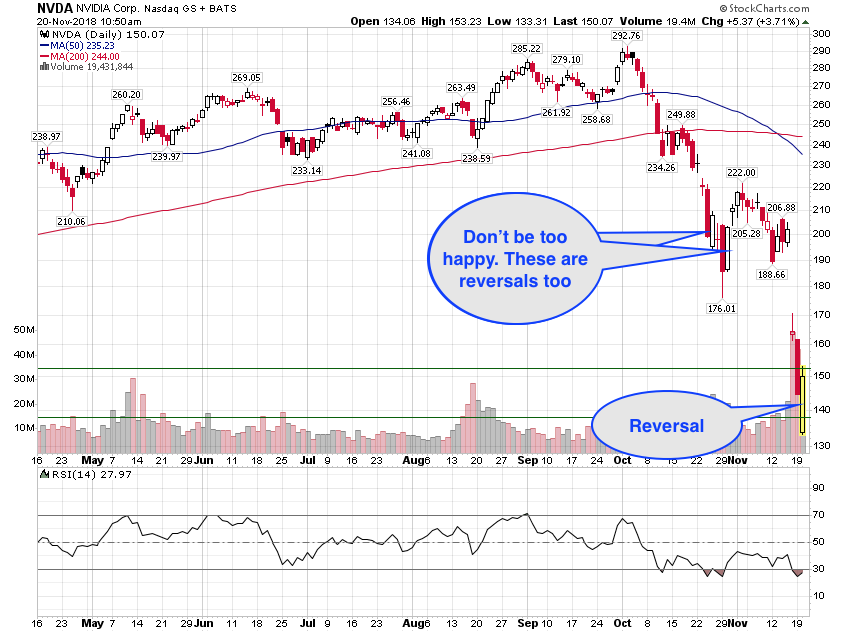
Didn’t sell FB, now more pain ![]()
Average purchase price slightly above 52-week low, about 4x of wqj’s purchase price. Now I am not sure of what I am doing.

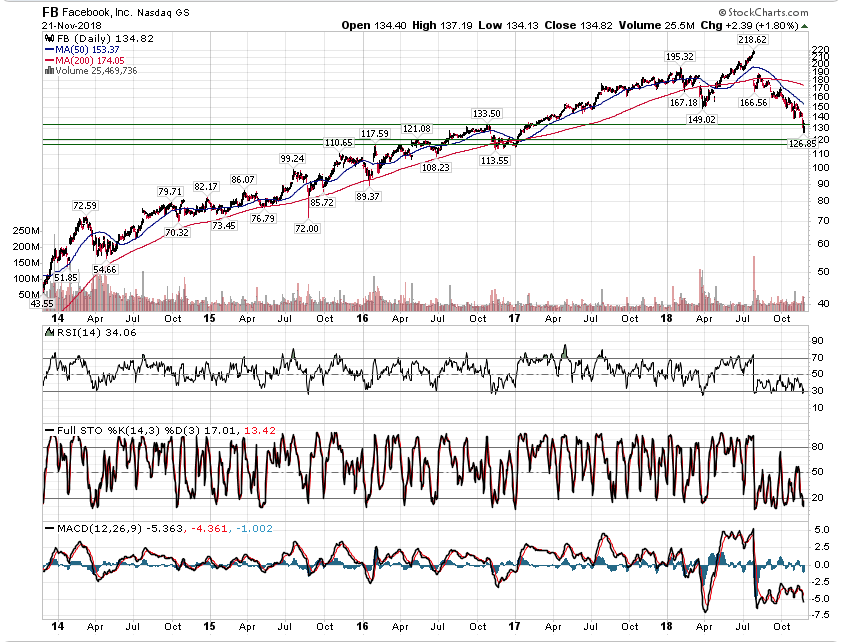
Unfortunately, these Technical analysis are bullish - bearish convergence within 0 to 100% range no matter whether they are ascending or descending. Same way RSI.
Both will not help when stock is tanking spirally and growing spirally. You see bullish divergence hit three times when stock dropped from 180 to 130.
Now is the time, neither fundamentals working, nor technical analysis working. Better be smart and judge our-self.
To be safe, bullish divergence or at least some bullish indication should appear in MACD and Stochastics too.
Didn’t see any in those two indicators. I think at this level, many investors/ hedge funds are buying… may be not in one-go because $115-$120 is still beckoning. That would be 2-year low ![]()
Seriously, Technical Analysis are showing past history until today how stocks went on. All the indicators, such RSI, MACD…etc are showing volatility of market how buying forces-selling forces interact in short term.
For example: RSI is 14 days past formula
MACD has the difference between EMA-12 & EMA-26 and signal for 9 days.
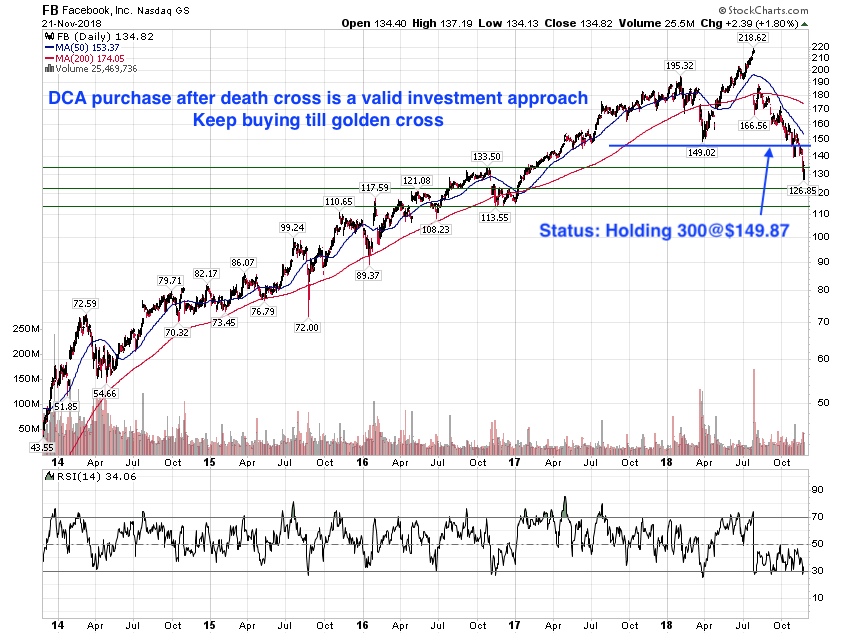
SMA-50 and SMA-200 are little long term (past history) indicator, that shows Death Cross or Golden Cross.
All are history, showing very short term sentiment except sma-200. These are to find when to buy and when to sell for trading.
I wrote an excel program with all these technical, showing buy and sell. This instantly gets 2 year data (or 5 year data), takes some statistics ( 1 sigma or 2 sigma ) to find best low point or high point.
Long term, it is fundamental (mainly company financials/quarterly results) reflect.
Current phase, neither fundamental nor technical is working as wall street sentiments runs.
If company fundamentals are good (like AAPL, AMZN, GOOGL, FB, TSLA) hold for long. If not, get out asap and move to strong companies or keep the cash on sideline so that we can enter at a later point.
Suddenly so pessimistic, market is bottoming soon!
2 Likes
Last qtr AAPL result was 63B and stock was $217, when they forecast 89B/92.5B, stock comes to $176.
Where is the fundamental support here? With the hope of bottom, we saw slide 5% every time.
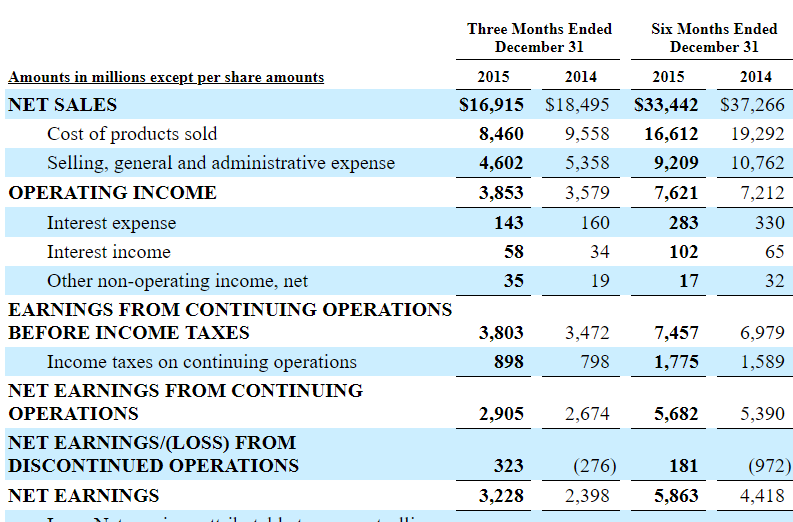
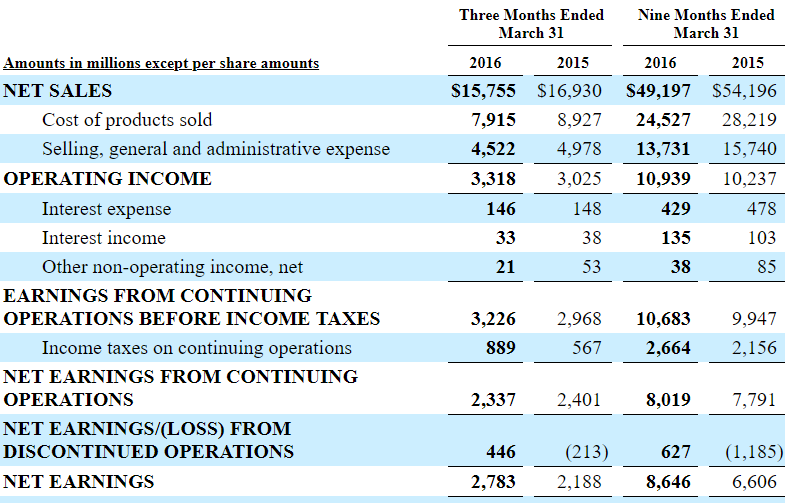
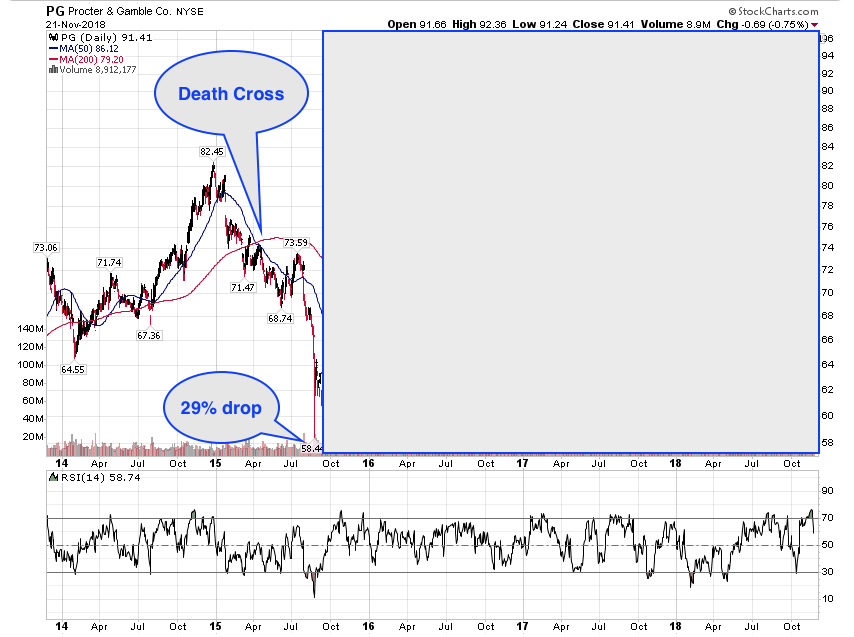
Look at the PG chart below, So liquidate a fundamentally strong company because of market rout in Aug 2015?
1 Like
Make money for whatever prices you purchase at after death cross.
Those who sold after death cross and bought after golden cross made less money than those who bought blindly after death cross.
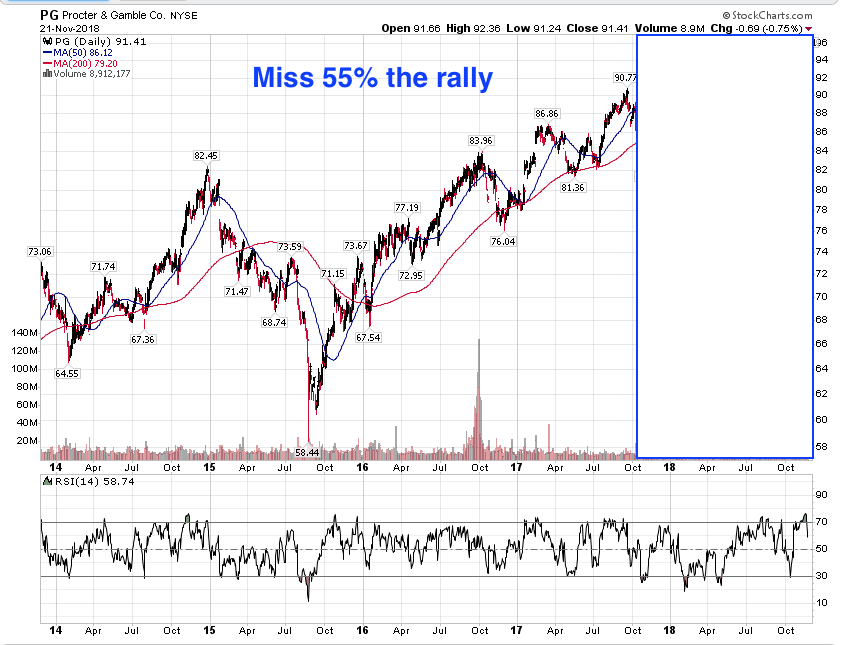
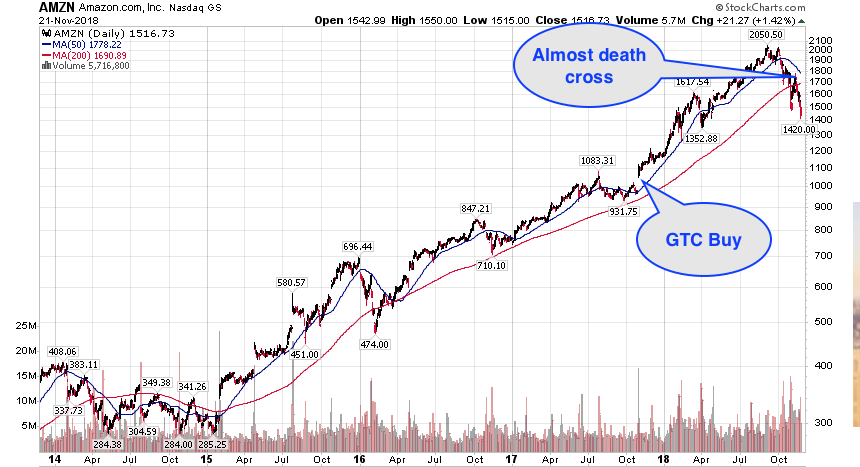
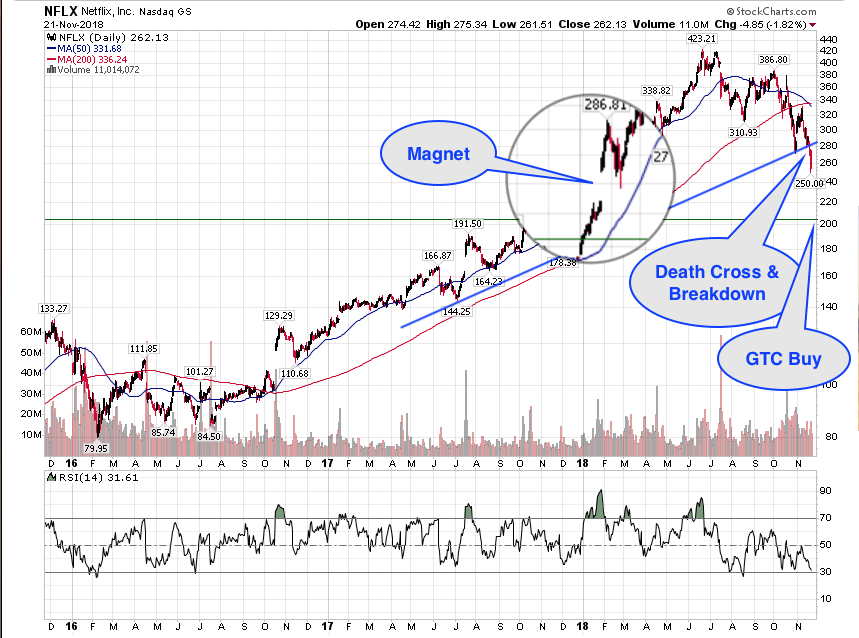
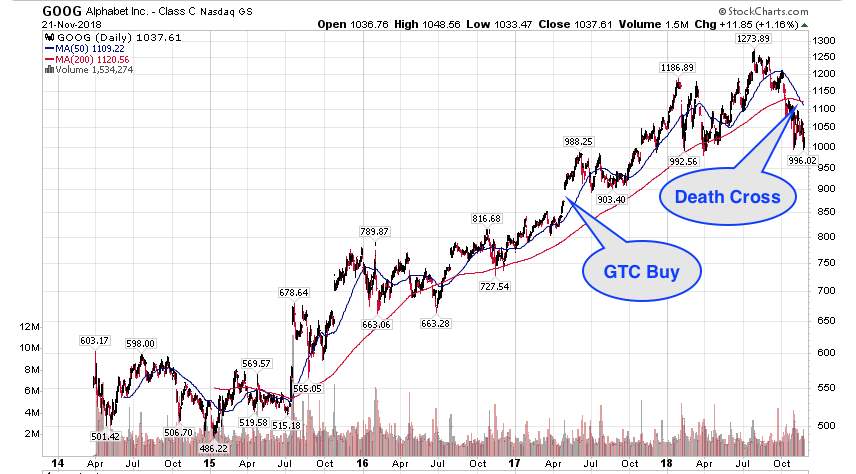
In short, for those who want to market time to buy a lot at one go, FANG is still too expensive  Ok to start DCA
  purchase though. Don’t have enough money to accumulate AMZN, NFLX and GOOG, just place some bets, GTC buy around the magnet. Focusing on FB only
  Hopefully the robot boy and the adult lean in don’t create anymore PR issues.
1 Like
During those period, Fall of PG is justified with reduction in sales every qtr to qtr. Share prices are justified/supported by fundamentals (reduction in sales). Company would have resorted to cost cutting, expense reduction to make up profits.
Reduction in sale/revenue resulted with share price slide. But, that is not the case now
Market inefficiency is there, good opportunity may be there, but we do not know when. Market may suddenly spike or uncertain