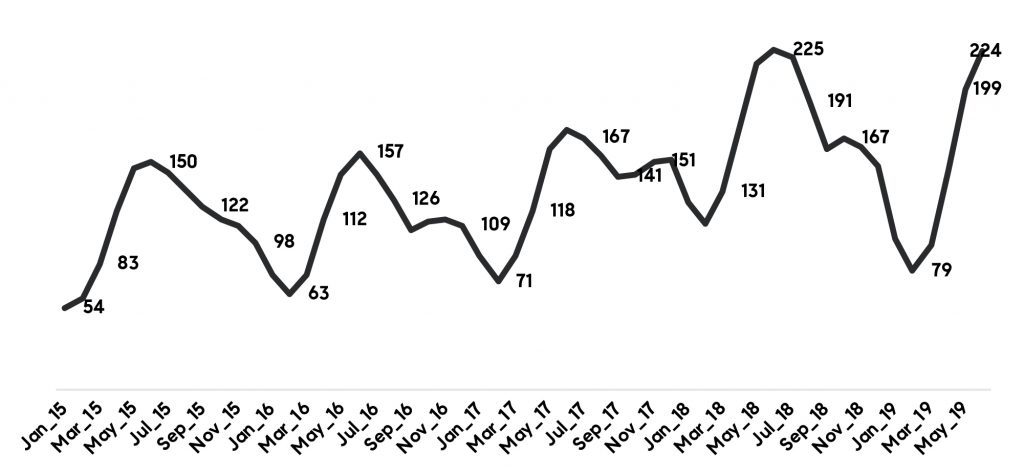
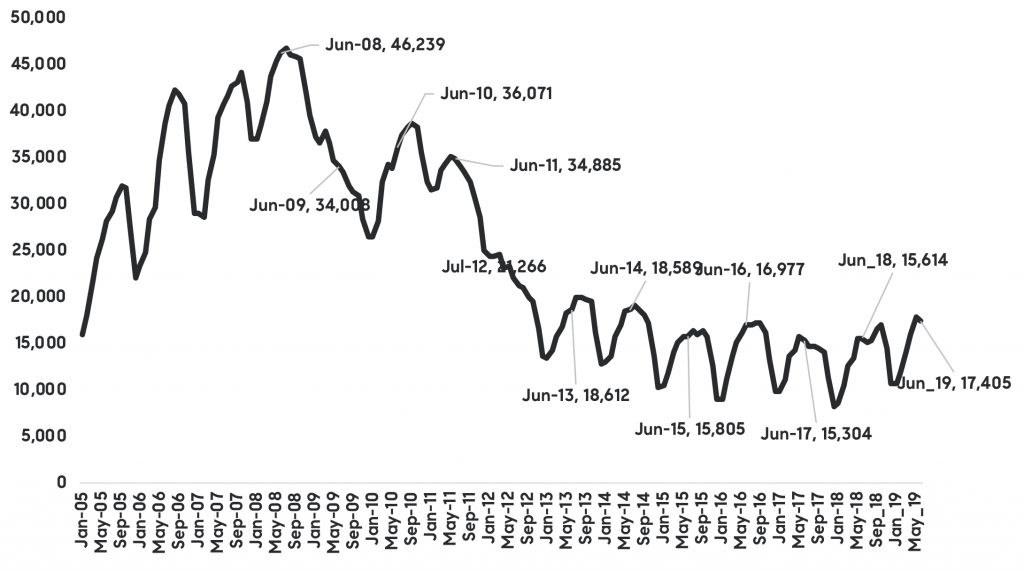
1. Higher-end sales surged. While the total number of homes sold in the second quarter trended below last year by about 5 percent, higher-priced sales, above $3 million, surged again bringing second quarter sales in line with last year’s historical peak. Figure 1 illustrates the 4-year trend of sales of homes priced above $3 million. There were in total about 672 sales between April and May compared to 675 sales last year. Note, though, that sales over $3 million declined about 25 percent in the first quarter before rebounding in the second quarter.
Figure 1 – 3-month moving average of sales over $3 million
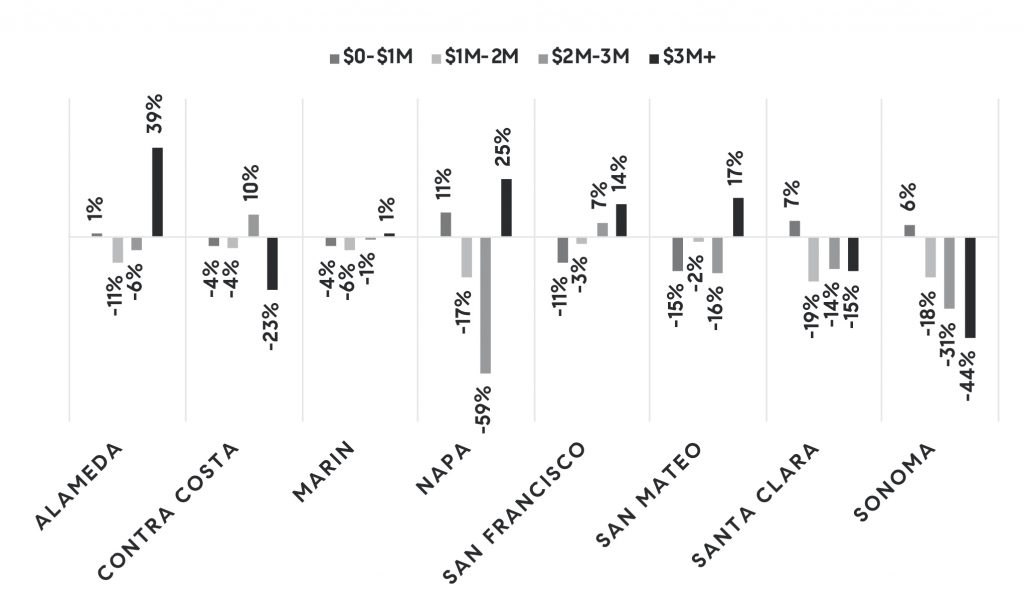
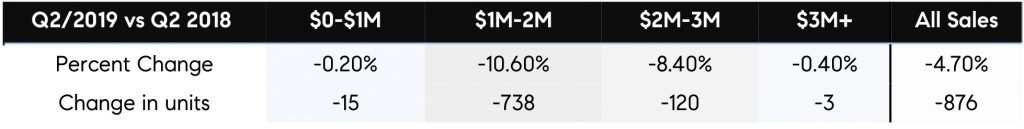
Figure 2 – Quarterly year-over-year change in home sales by price range
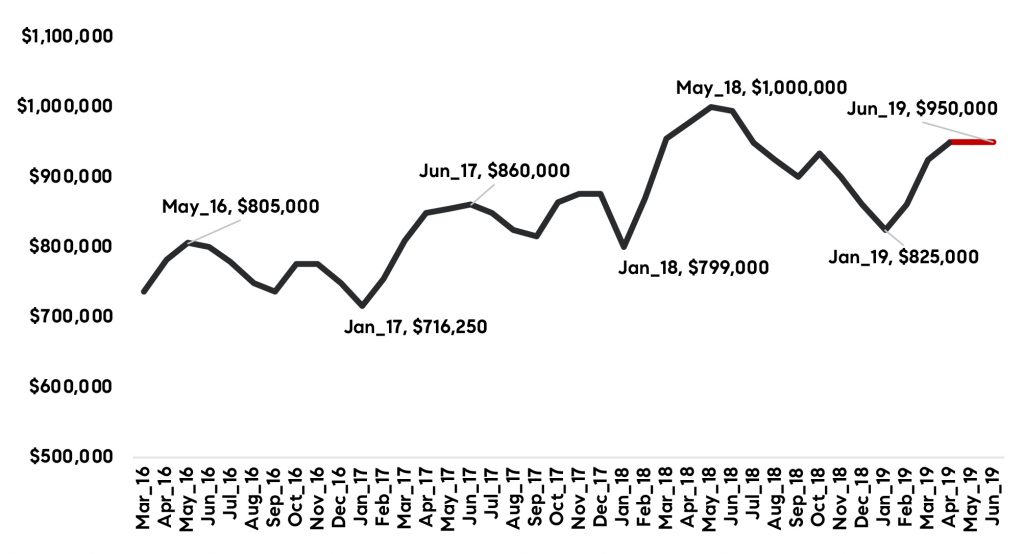
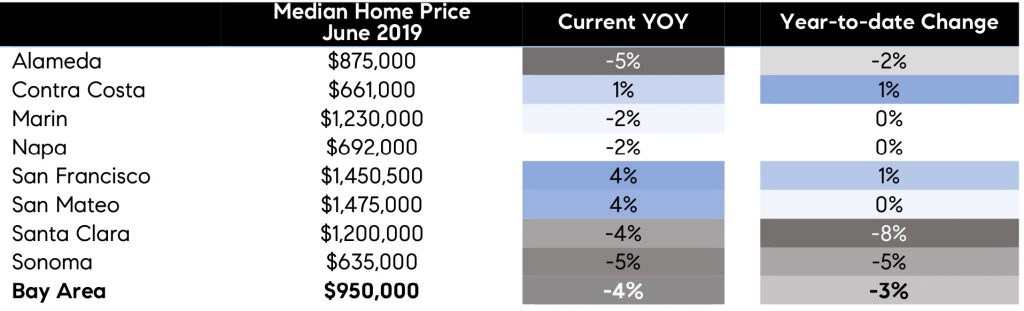
2. Home prices remained flat in the second quarter, except in San Francisco and San Mateo. As noted in previous analyses, home prices in the Bay Area reached a cyclical high last May when the median price topped at $1 million. Since, the prices followed seasonal declines reaching the lowest point in January and have increased since. Figure 3 illustrates Bay Area median home price trend over the last 3 years, pointing to seasonal highs around May-June and troughs in January. Second quarter 2019 is highlighted in red illustrating flattening of home prices in recent months.
Changes in Table 1 also closely reflect the forecast that was presented at the Pacific Union Real Estate Economic Forecast 2020, illustrated in Figure 4. The forecast called for home prices reaching a “Table Top” in 2019-2020 — when prices reach peaks and remain relatively flat with some slight declines in a few areas. As Figure 4 shows, “Table Top” is much different than the “Mountain Peak” that was experienced during the last housing cycle in 2004 to 2007 when home prices rapidly declined as much as 60 percent following the peak.
Figure 3 – Bay Area 8-county median home price trend
3. For-sale inventory growth slowed considerably. While overall inventory is about 11 percent ahead of last year, inventory growth and addition of new listings has slowed, suggesting that acute lack of homes for sale continues to hang over Bay Area housing markets.
4. Lastly, tax reform is likely putting a damper on the market by dragging down sales priced between $1 million and $2 million. While the quarter ended with 5 percent fewer sales than last year, or 876 fewer sales, 84 percent of the decline, or 738 units, was due to fewer homes sold priced between $1 million and $2 million. Table 2 summarizes quarterly year-over-year change by price range.
In contrast, sales of units priced below $1 million, similarly to sales over $3 million, remained flat from last year, with gains in Alameda, Santa Clara, and Wine Country offsetting losses in San Francisco and the Peninsula mainly due to no inventory in the lowest price range.
Yeah, mostly likely. I think we get our answers how the IPO wave is affecting the Bay Area RE market. The table-top prediction is also interesting. If prices go flat for a couple years, will it be like a loaded spring waiting to explode? Or is it my wishful thinking?
 Fundamentals have changed structurally.