You are misinterpreting Panda. He tries to do the impossible, predict the exact pattern of wave four! He fails, expected so, that doesn’t mean it is not a wave four, and there would be a wave five!!!
My issue is: I see SPX top in May but QQQ rally remains STRONG… probably till 2022. Can’t be if there is a huge overlap in the index. I have 1-2 months to figure out what’s wrong.
Shouldn’t market is always right? And economists are always wrong? You side with economists because it is inlined with your belief? You made the decision before you see the data!!!
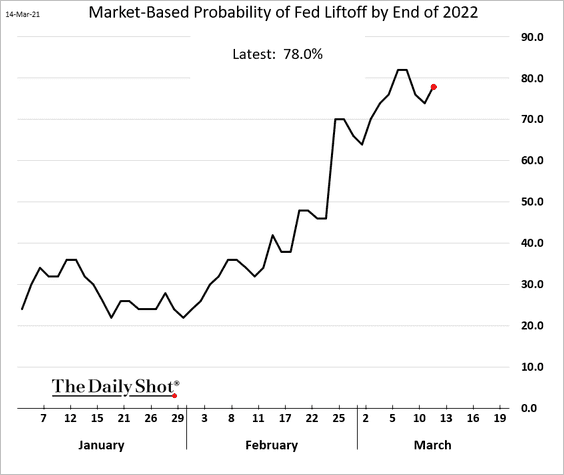
Even if you aren’t persuaded by this statistical significance, these results show that the market is risky right now.
If market is always right there would be no panics and manics. Last March the market fell thru the bottom. Was it right? If so how come people buying the bottom doubled, tripled or in our own Master Wu’s case, 10x their money?
If market is always right you are wasting your time looking for bubbles. There couldn’t be one by definition.
You don’t get it. Whatever happened is the market. Market is always right by definition Market responds very quickly to changes, risks or rewards, always priced the odds accordingly. When those changes are clearer, market moves accordingly, get it? Market is always right because whatever happened is the market. Market is always right at any point of time. Future is another story… fundamentals , risks and rewards are not known yet…
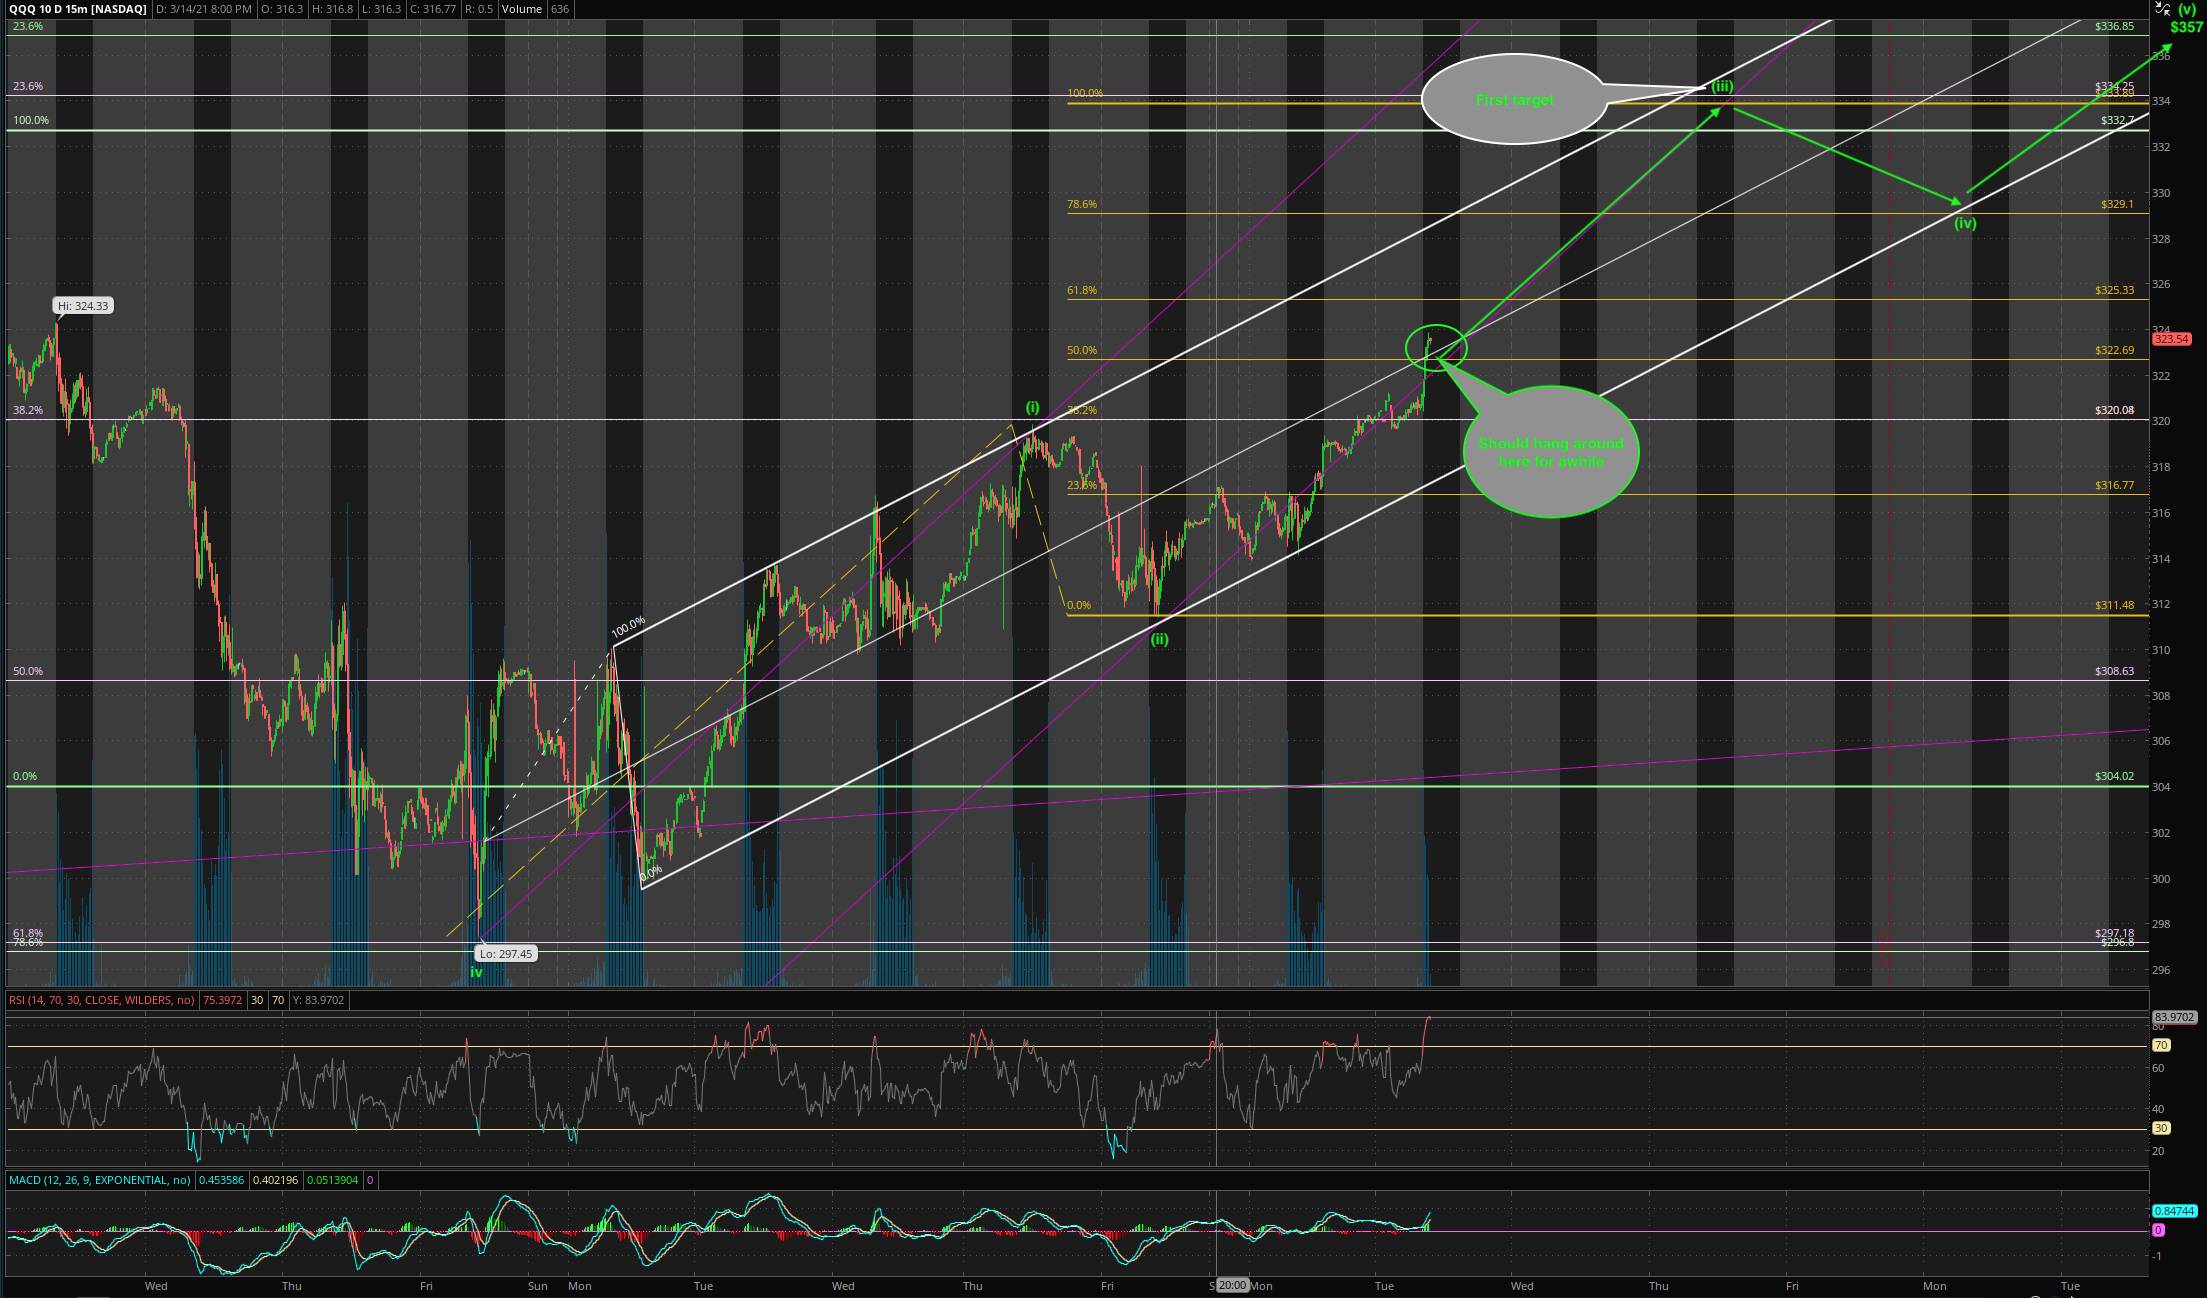
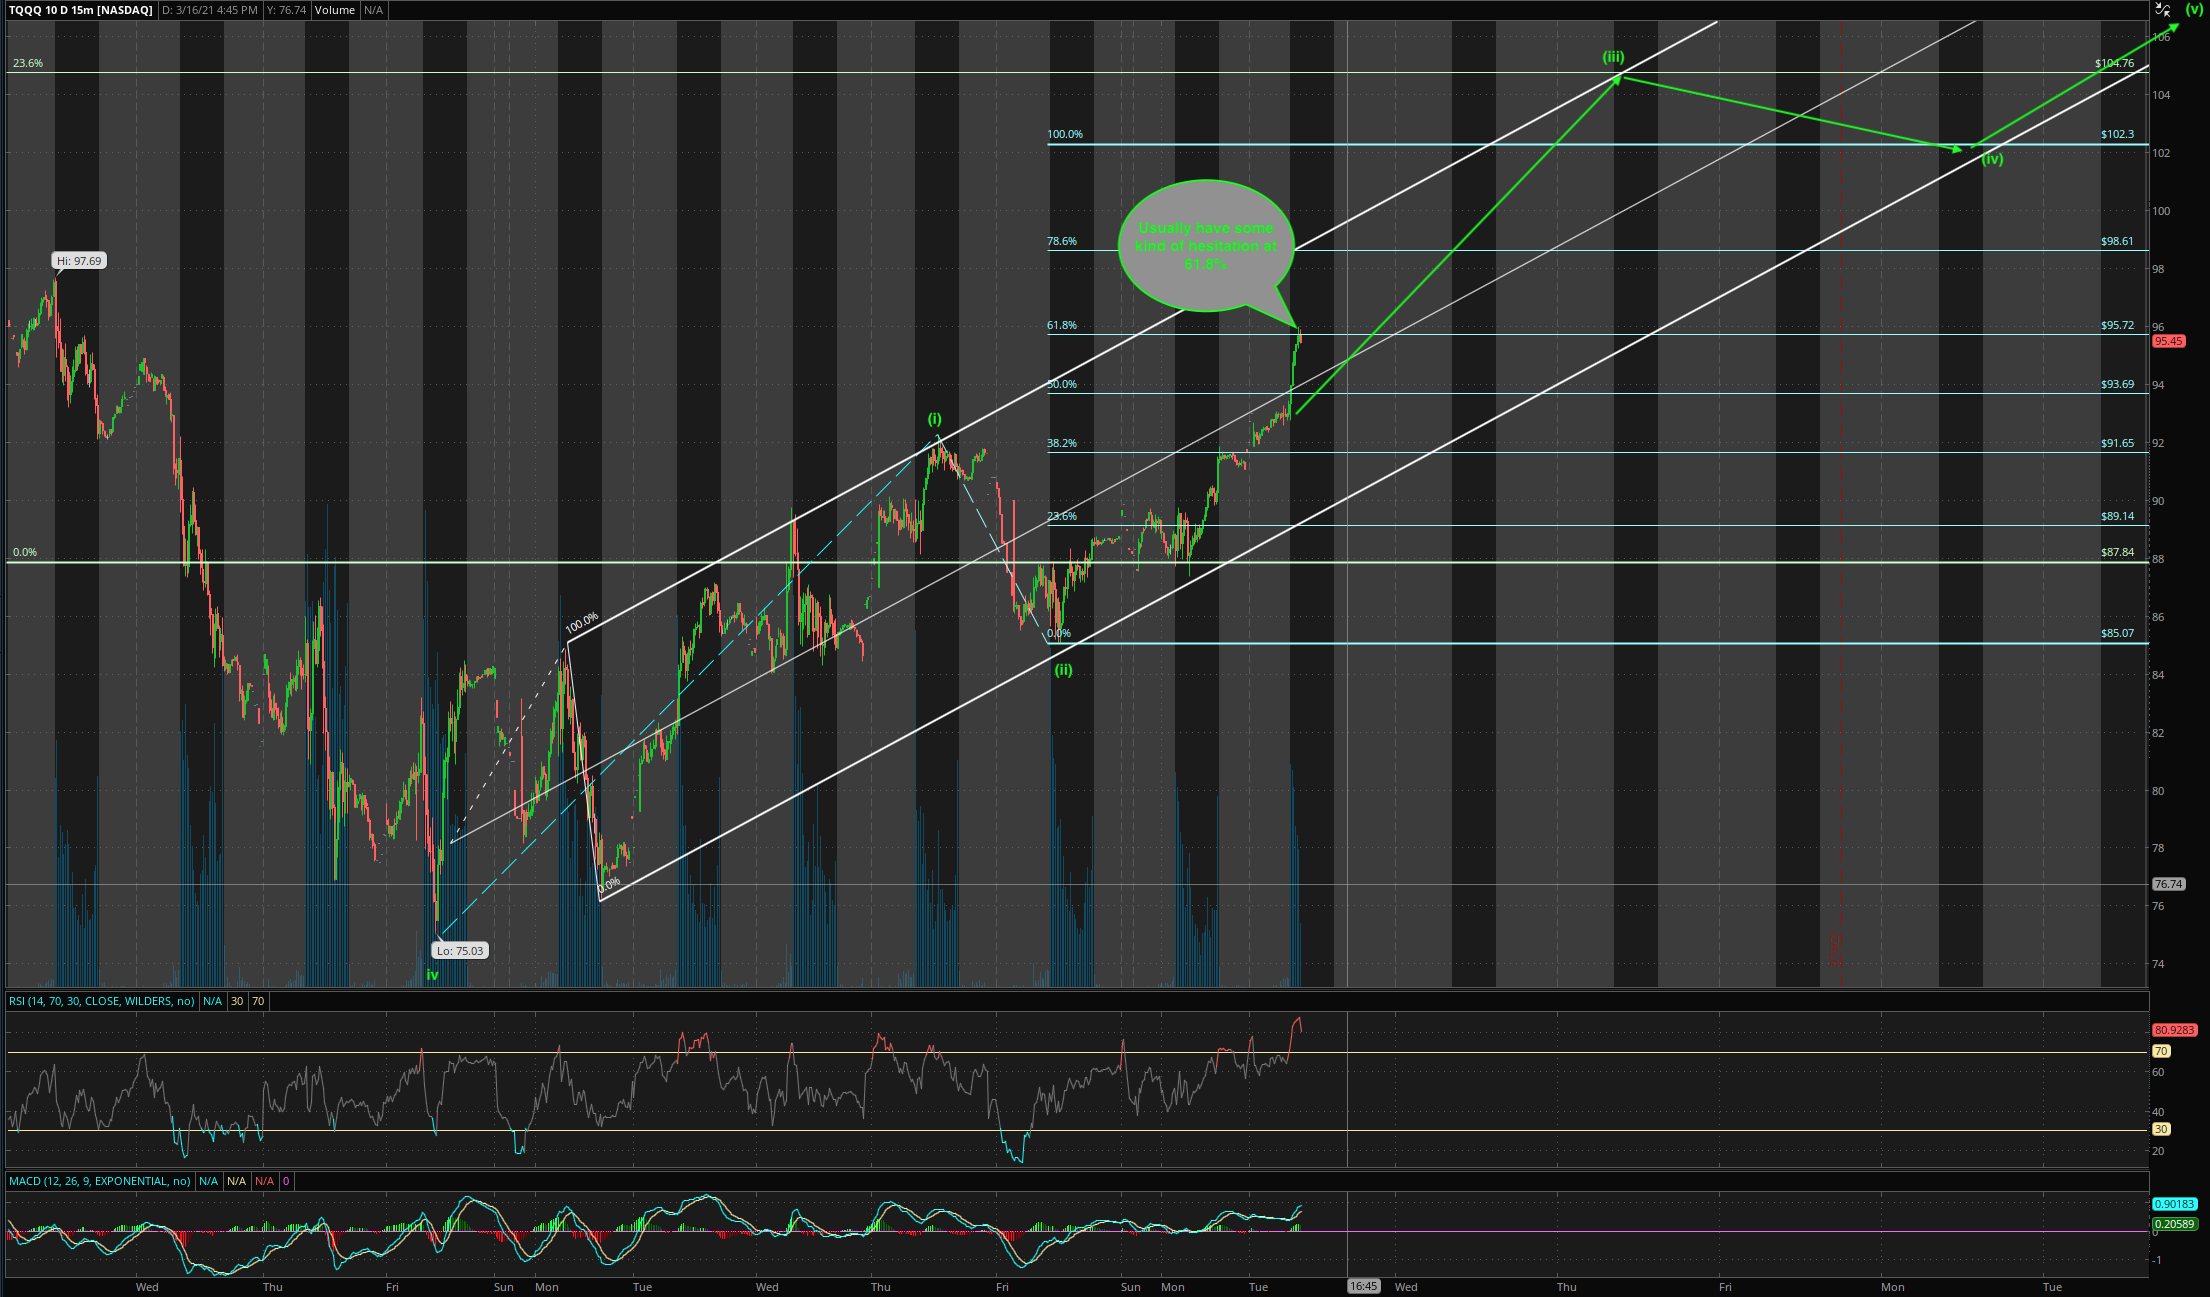
Under pressure/ demand from @manch of concrete targets and dates, although I have not learned any Cycle/Astro and don’t have any top killers like Panda, I have used whatever I know to forecast some Below is the chart for QQQ forecasting targets/ dates (for a laughter, please don’t take it too seriously, still in alpha)…
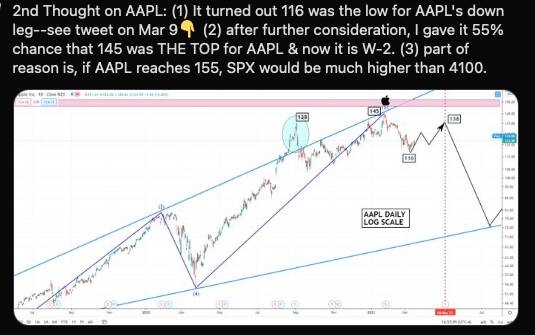
Not saying his count is wrong. He tries to do the impossible, predicting the pattern of his W-4 (wave four) which is impossible. Why must it be a triangle? Why not a running flat (which is very common in today market, see them often) or an expanding flat? So assuming his count is correct, now is in counter-trend wave b UP, before coming down, and then last final blowoff. My count is actually different from his… need to go out to run errands… I am very BUSY
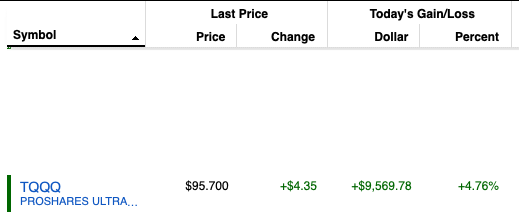
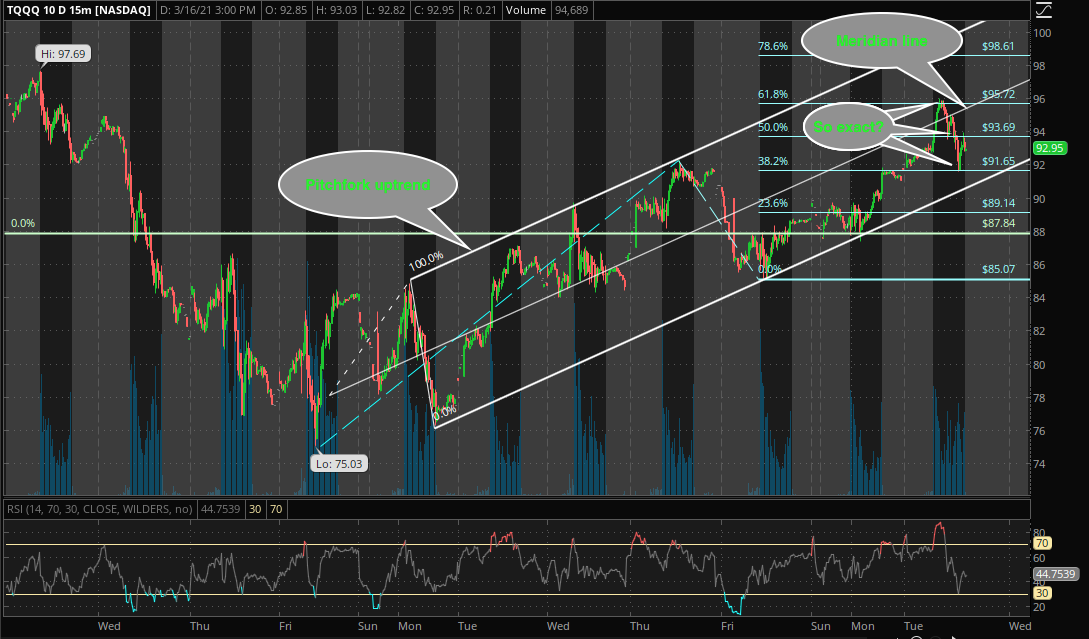
Ratio of the up leg for TQQQ is 1 : 0.618 which is the ideal ratio of a zigzag i.e. what follows could be a DOWN wave. While admiring the exactness, I forgot about the possible danger.
As for SPX, didn’t look at the chart and wasn’t login to ToS, looking at Yahoo!, seem more like is a minor degree (multi-day) wave (1) completed, 2mrw may start wave (2) DOWN. As I said before, my count differs from Panda.
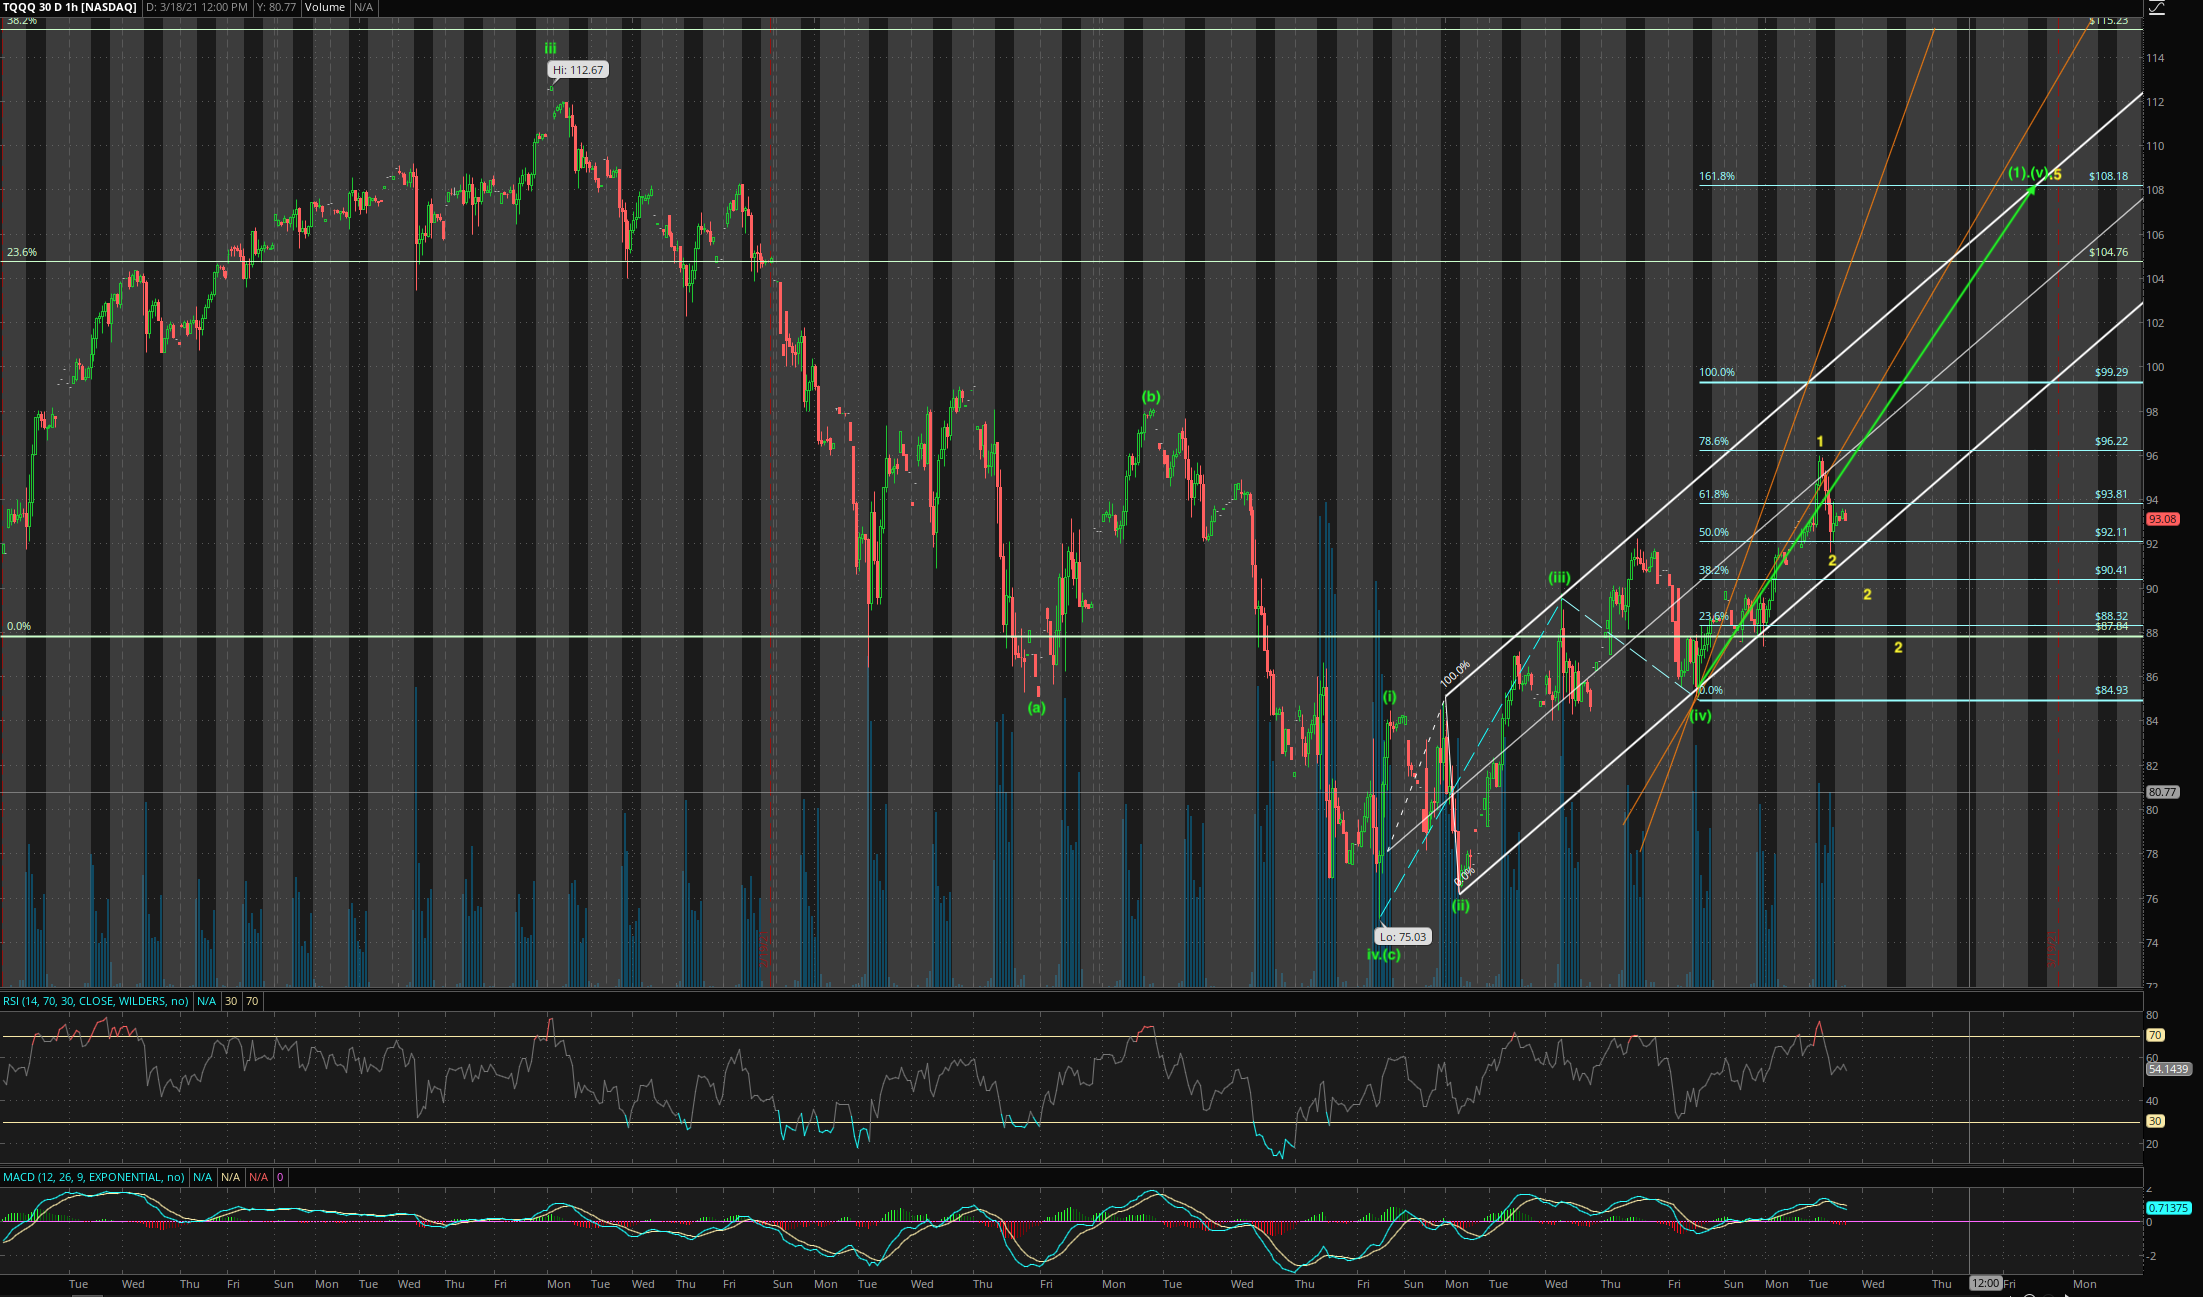
After many agonizing hours, there might or might not be any downdraft for TQQQ, I am not sure wave 2 in yellow has completed or not… is UP after that so long TQQQ doesn’t drop below $85… long way to drop from $93 well, Fed can do wonder to the market so… Even that is still bullish since merely changed 1 in yellow to (i) in green… still UP so long is not below $75 At the end of the day, only need to worry if you are a day trader to day2day swing trader. Weekly swing to position traders can just sit and watch.
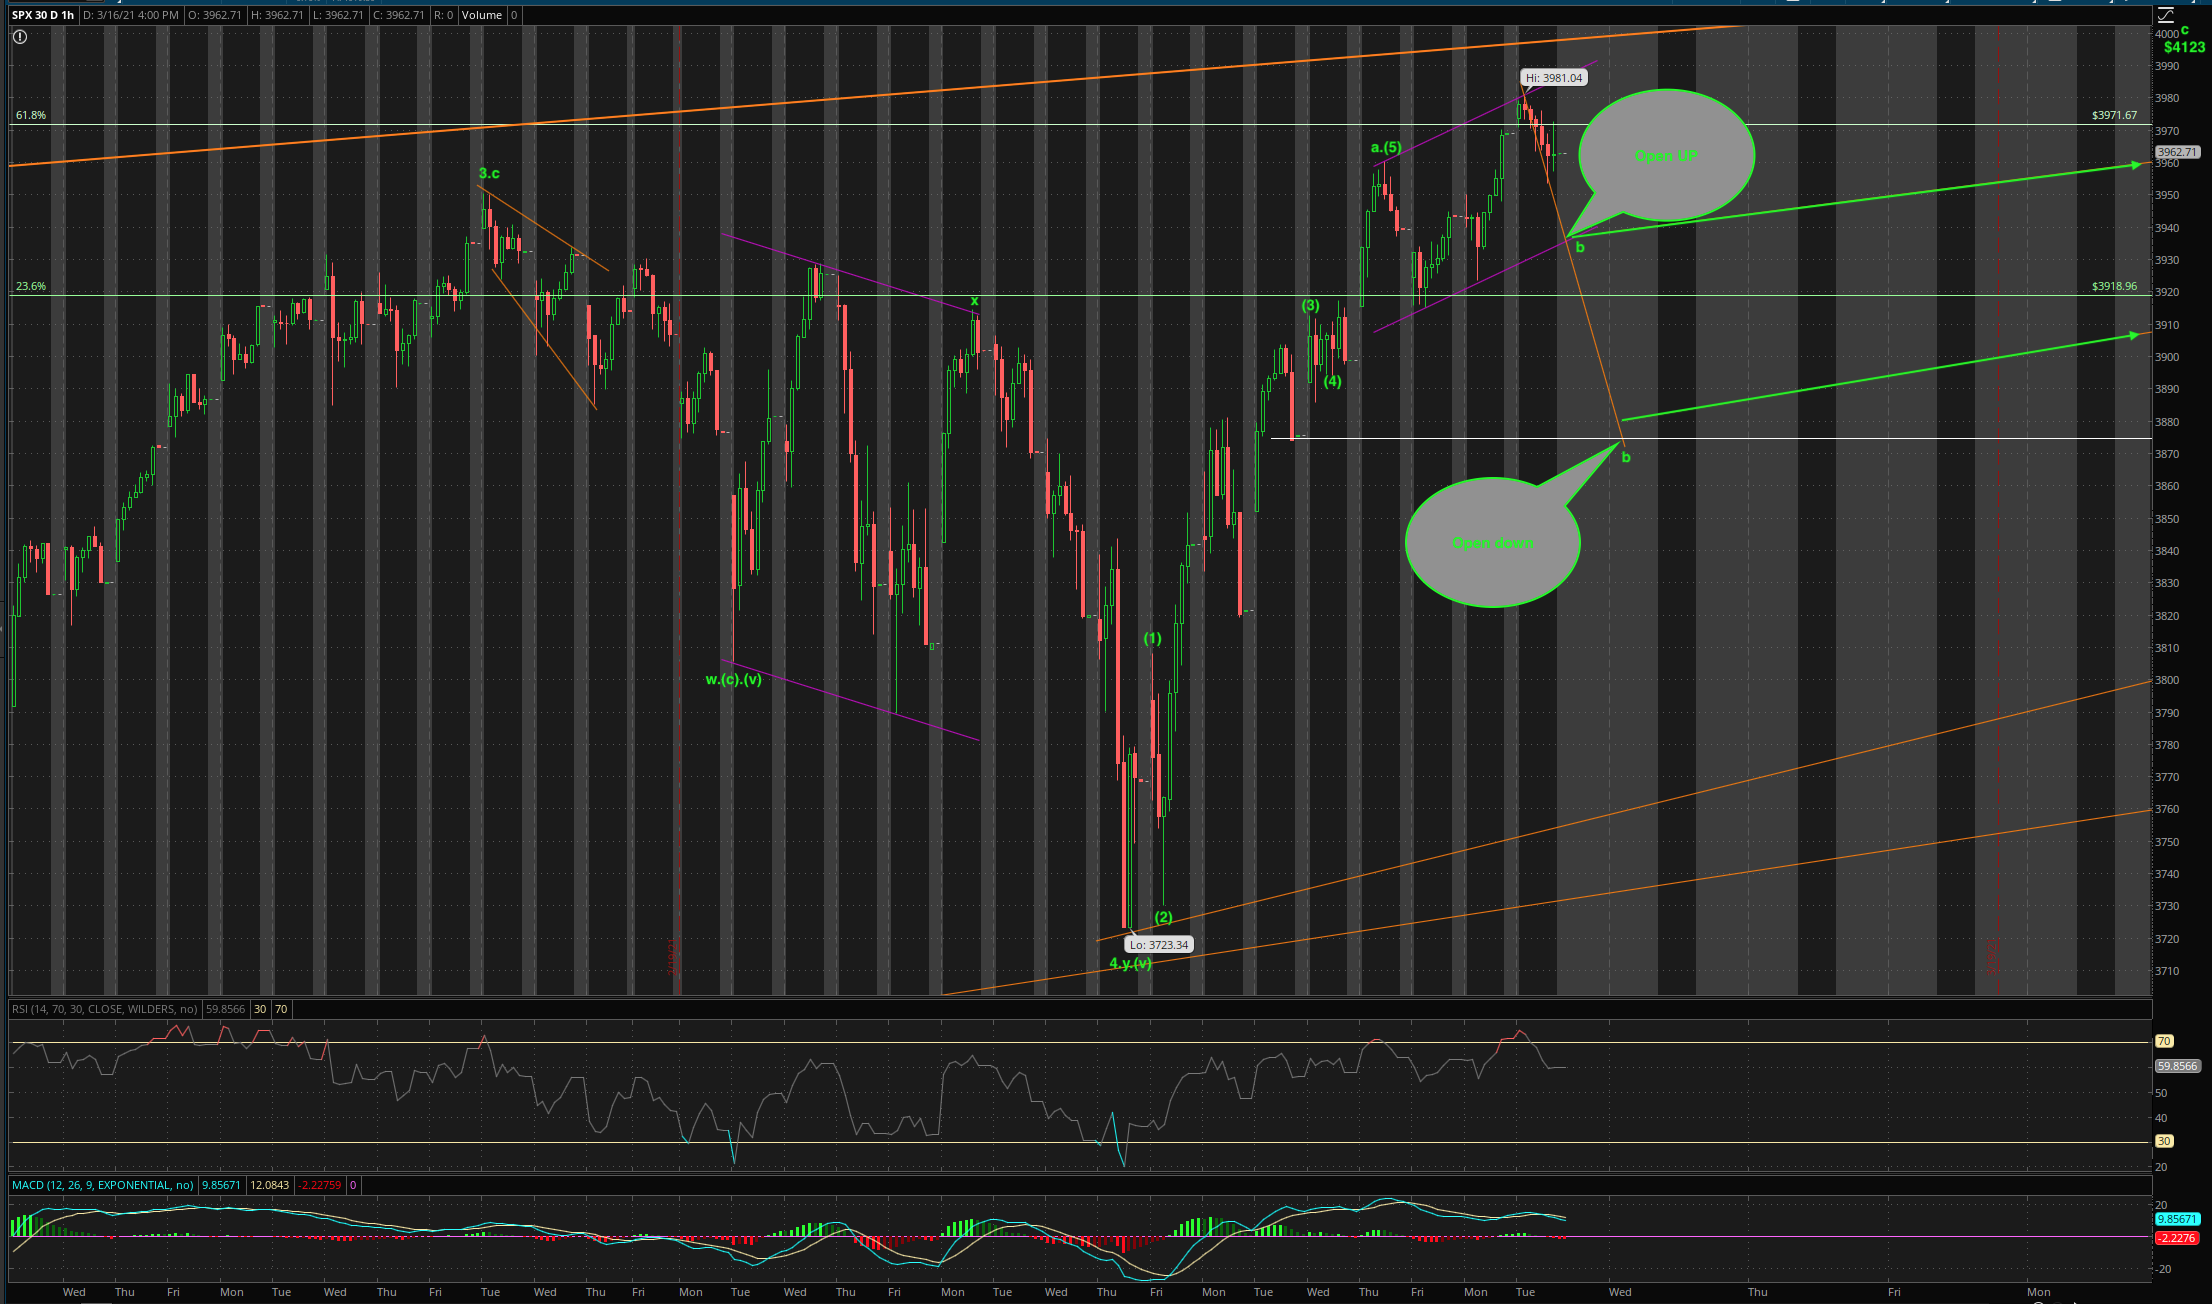
I thought I have posted a chart on SPX… not in this thread… may be in other threads… no point wasting time to look for it elsewhere… below is my super duper SPX count
So depending where wave b in green is completed, either open UP or DOWN My worse case low for SPX is 3875 before resuming the last final UP wave to 4123. Panda’s chart indicates the DIVE is to 3780??? I have sold all S&P index funds and VOO… no point holding them for another 5% gain. Less tickers to monitor, easier for me.
Notice I am expecting a whimpering last leg and not rocketing one as per Panda. Slowly grind up and down till 4123 on May 5… mark on your calendar.
Panda may be full of crap but at least he puts bets on clear targets. Enough with talking both sides of your mouth. What’s with this up or down crap? I know that without fancy pants EWT!