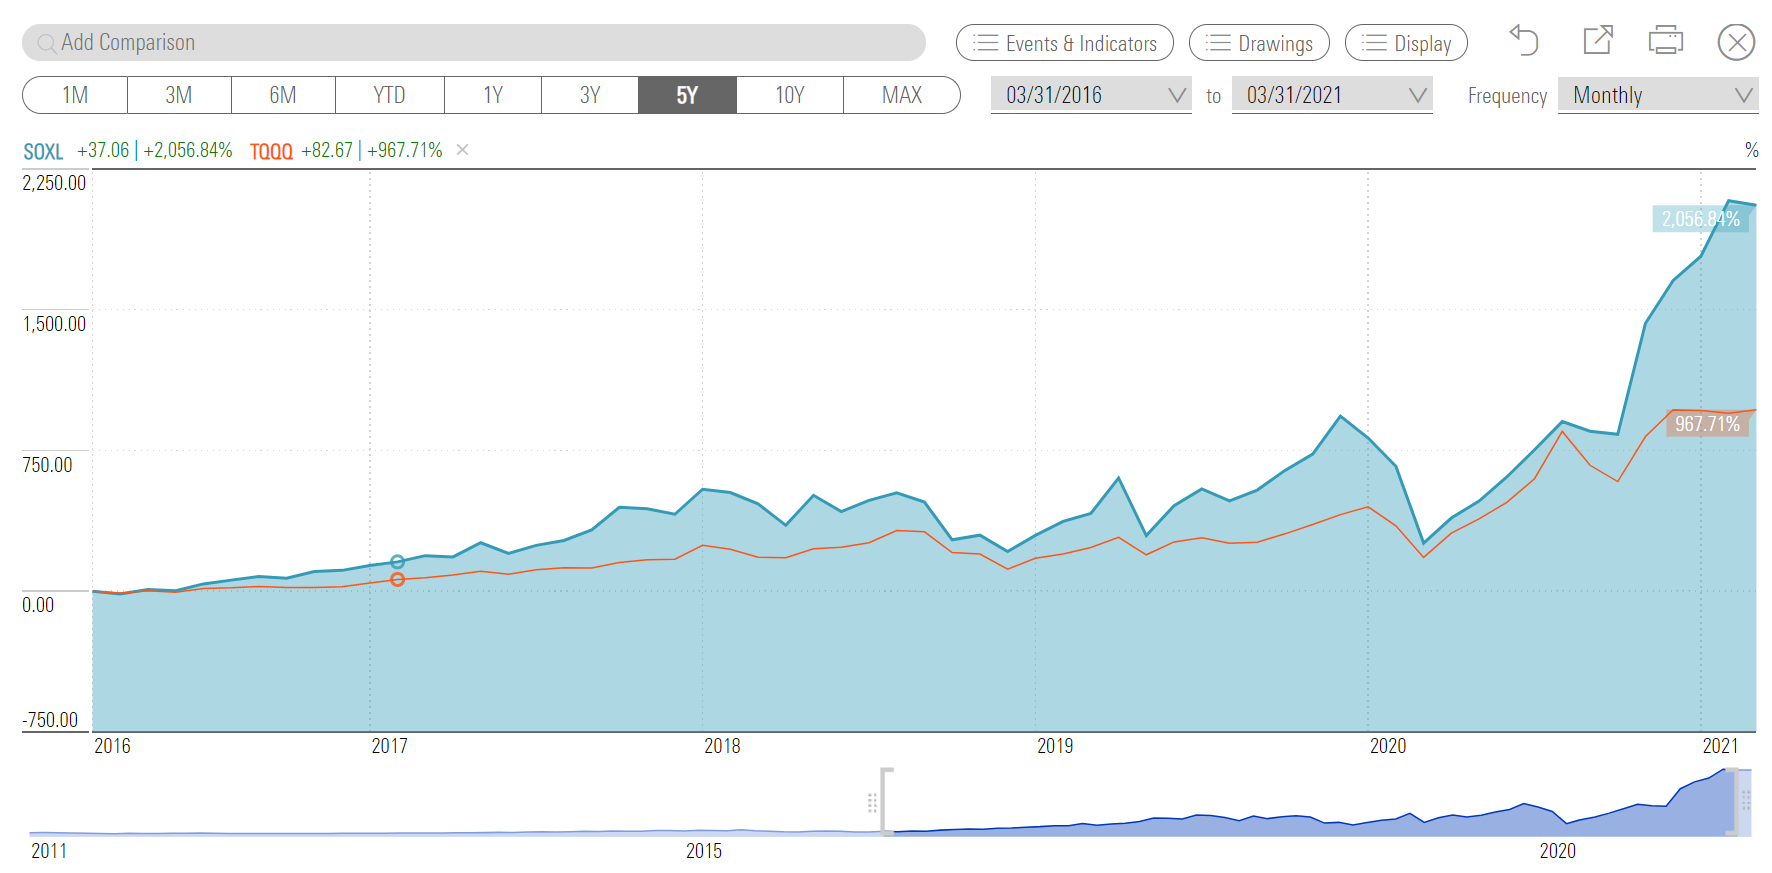
I stayed away from SOXL as I can not monitor other than ^GSPC and ^IXIC, but looks like market bottom and top affects SOXL too ! Still need to monitor SOXL and TQQQ. Your IBD post is very useful.
Even Morningstar gives 2000% in 5 years for SOXL and 967% for TQQQ.
There is one caveat that may apply with today’s environment though. While it’s rare for the stock market to fall during a booming economy, it’s also rare for the stock market to boom in the midst of a nasty recession like it did in 2020.
There is the possibility of a “sell the news” reaction by investors now that the market is already up around 80% from the bottom in late March 2020. That is a risk worth considering.
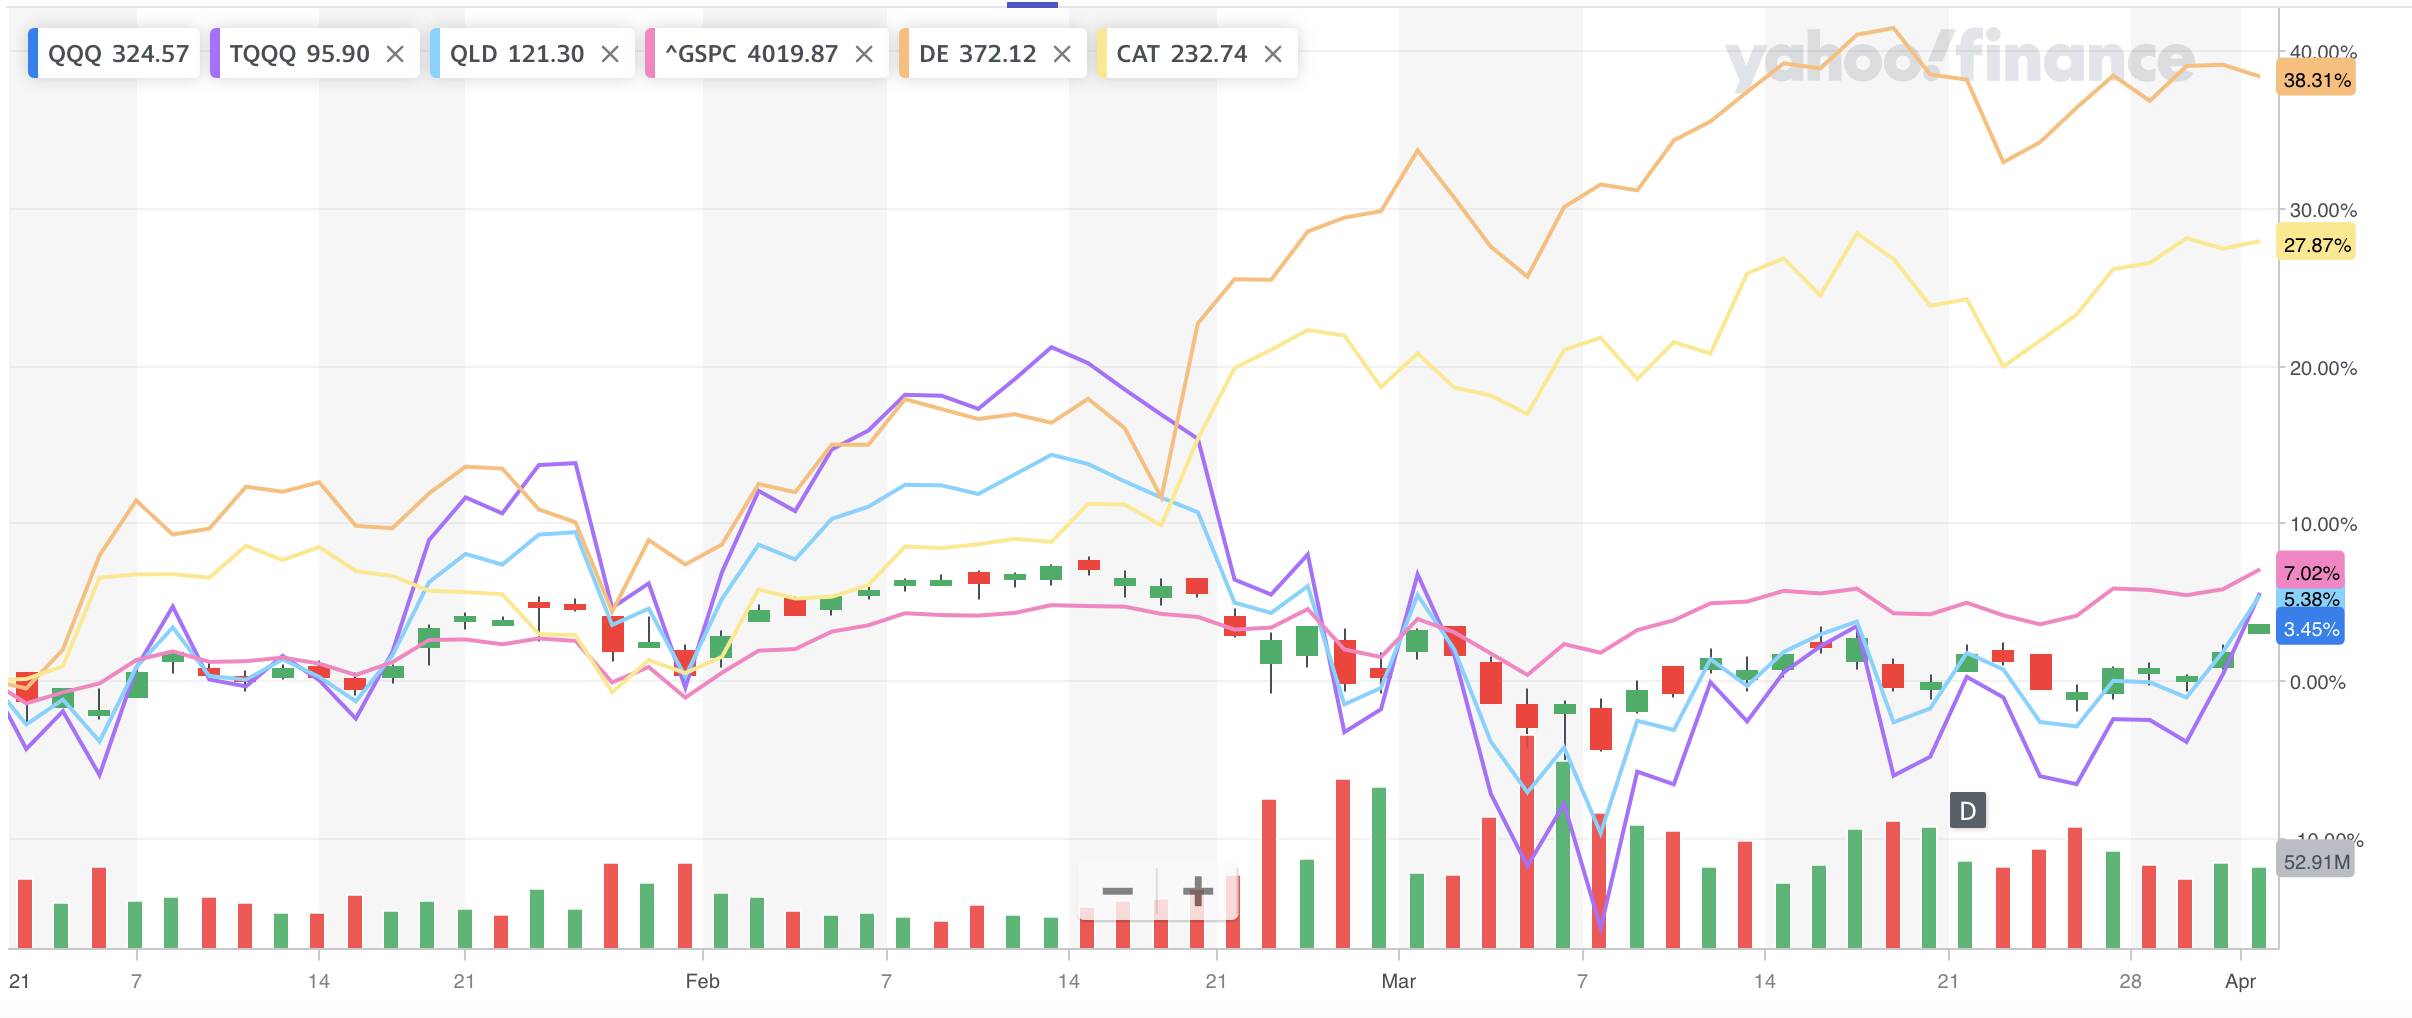
Re-opening economy means don’t buy tech stocks? Buy old economy stocks like CAT and DE. I have both of these, albeit, a small quantity compared to other stocks.
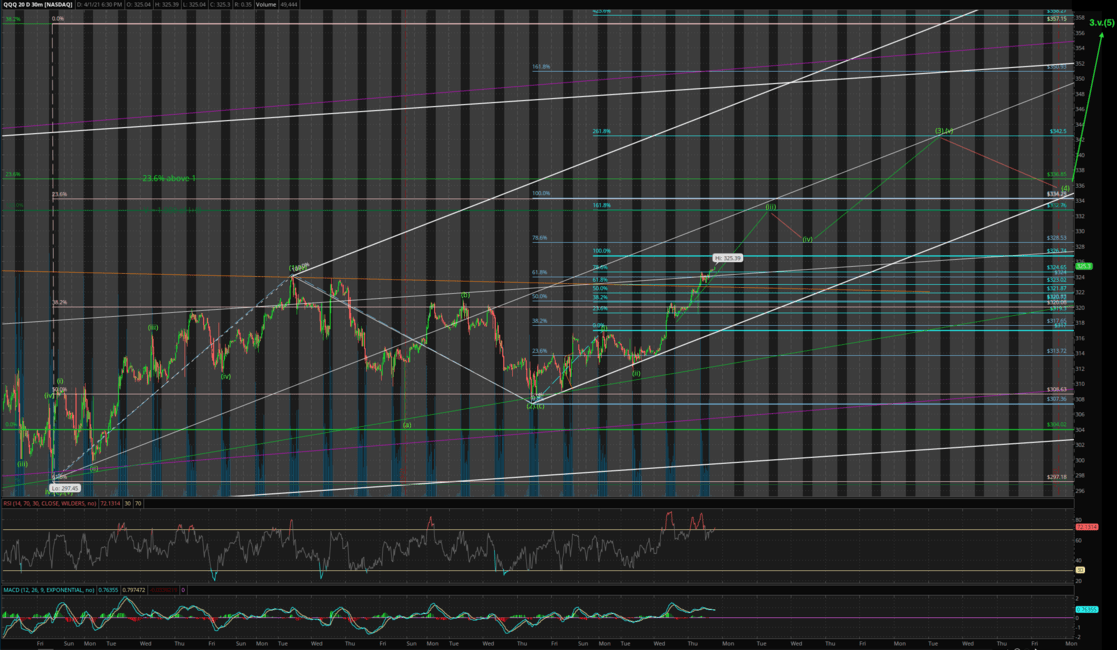
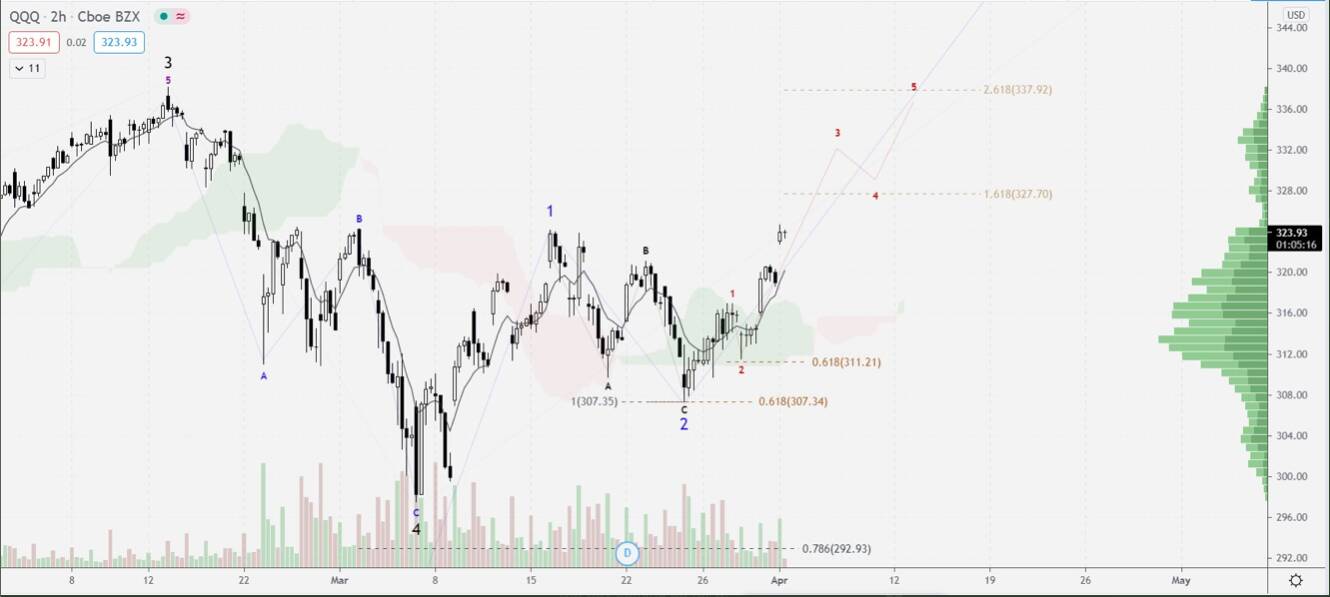
Below is my labels for QQQ count (Paul and I use different labeling):
Multi-year trend (wave V) = Up
Multi-month trend (wave 3) = Up
Multi-week trend (wave v) = Up
Multi-day trend (wave (3)) = Up
Hourly trend (wave (iii)) = currently up, may or may not have completed.
Paul is bull counter Only show his count when the stock is in uptrend… silent when it is in corrective wave. He doesn’t predict that far… he is a swing trader like @Jil and do a little day trading. He doesn’t hold position for more than a few days most of the time so crash or no crash, doesn’t matter, he is out of the market. This is deduced from his tweets… his actual investing style, I don’t know.
Since everybody want to be a smart ass predicting concrete price targets and dates, I have to follow such social practices, below is a chart showing QQQ’s concrete price targets and dates This is provided for a giggle only, not to be taken as professional financial advice.
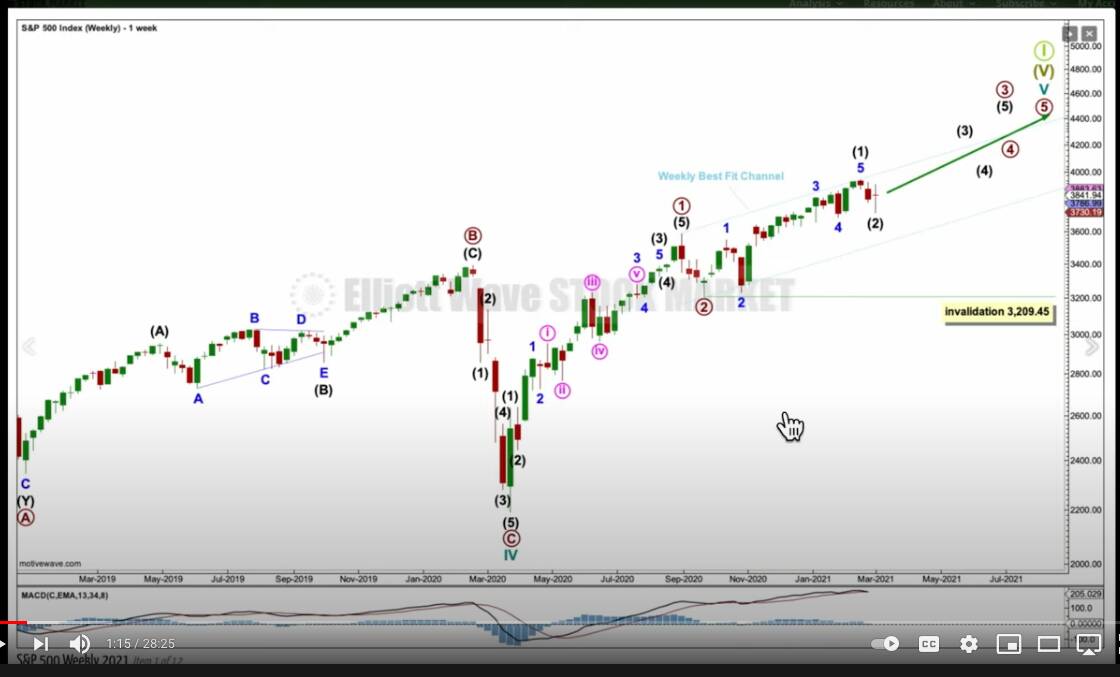
I found a count for SPX by Lara that you would believe in. Epic climb to 4400 with minimum drawdown. She gave an elaborate explanation of her choice for almost every waves… would bore you so I don’t bother to link the YouTube, just take a screenshot.
Ok, I lied. Her count indicate a century corrective wave after hitting 4400 around Jul-Sep, so at a higher price level and at a longer timeframe than Panda.
Although my count differs from her in details, but quite similar price target for completion of century wave [I]. As for dates, her is Jul-Sep, mine is May-Jul. Cut n paste my count again for easy reference,
Doomsday? Just a century wave [II] corrective wave (likely to be a counter-trend)… look further out… it would be followed by EPIC century wave [III]… powerful uptrend! that last many many decades. Don’t be so pessimistic and myopic, you should be able to live to see the EPIC uptrend, wave [III].
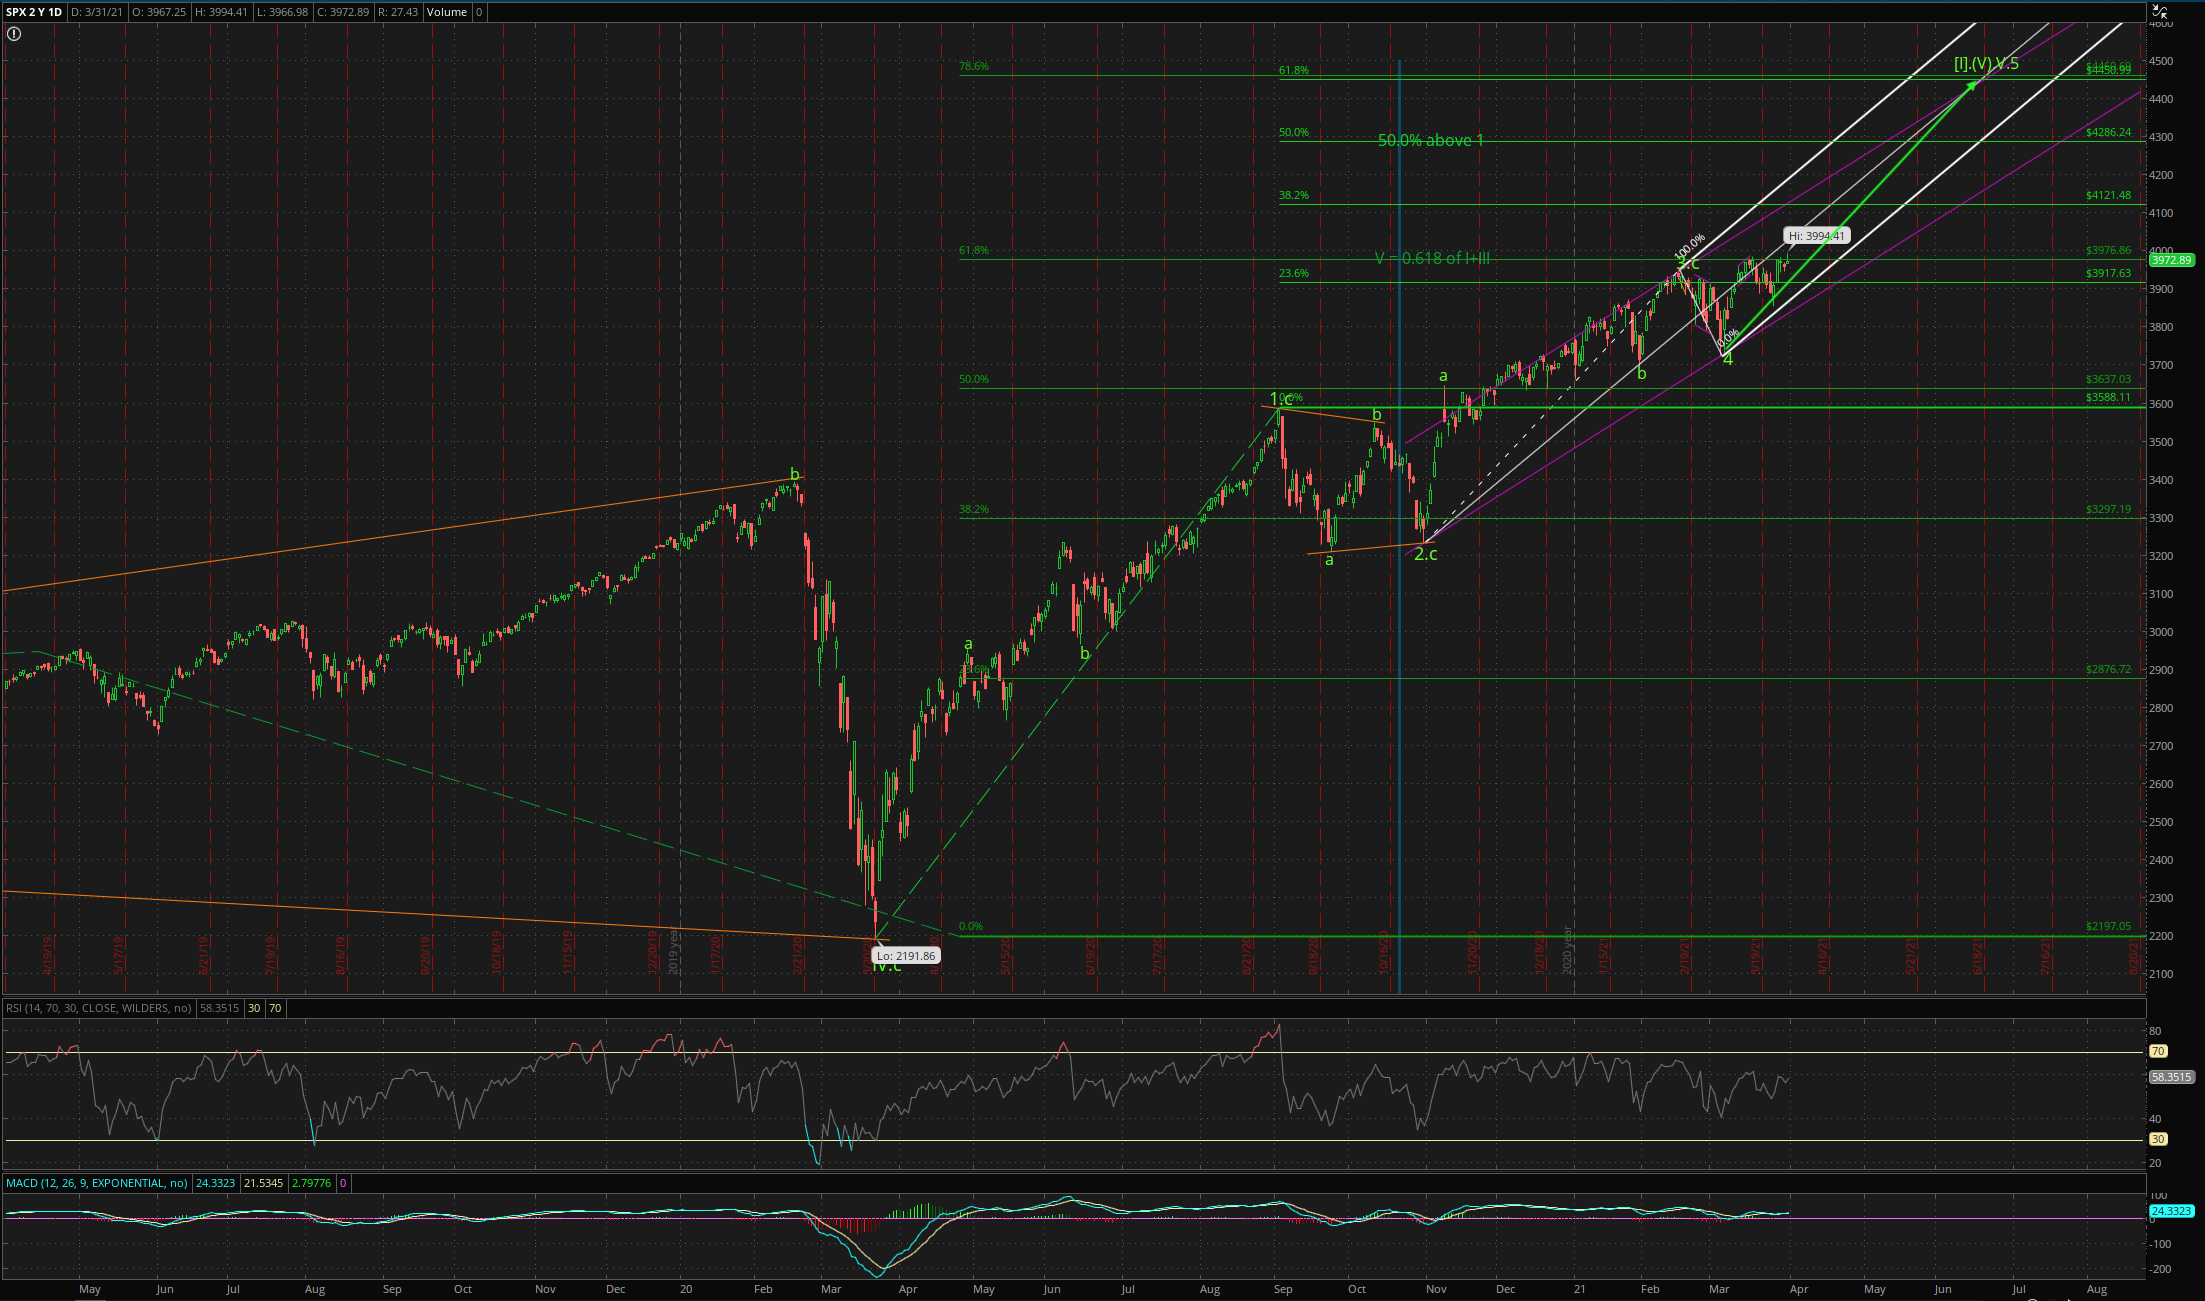
Didn’t develop a bottom fish indicator yet Well, EW doesn’t talk in those terms. Retracement of wave two is 23.6% to 99% of wave [I]. Given the way Fed works, we can look forward to best case scenario of 23.6% retracement SPX ~3400. Panda Wu predicts bottom at 2200, that is 50% retracement… working norm for wave two retracement. He seems to think it is going to happen very fast, over 1-2 years rather than long drawn over few decades… I don’t have bottom fisher indicators nor know how to estimate dates… only know how to estimate price levels.
Whatever it is going to be a tense May-Sep Can happen any time in that time period… if not, then we’re all wrong.
Since @manch is so lazy to search the YouTube, I look up The Popular Investor for this latest update…
Essentially no change in his position since the last post about his view (link?). Just to summarize…
a. 3-6 months of disinflation so big tech will do well, he bought QQQ for that. 3-6 months mean Jun-Dec And also bought bonds
b. After 3-6 months, he expects inflation to rear its ugly head again and stock market would experience a fairly large drawdown All elliotticians saw this vision, he is also an Elliottician.
 Only show his count when the stock is in uptrend… silent when it is in corrective wave. He doesn’t predict that far… he is a swing trader like