Below is what @manch wants to see…
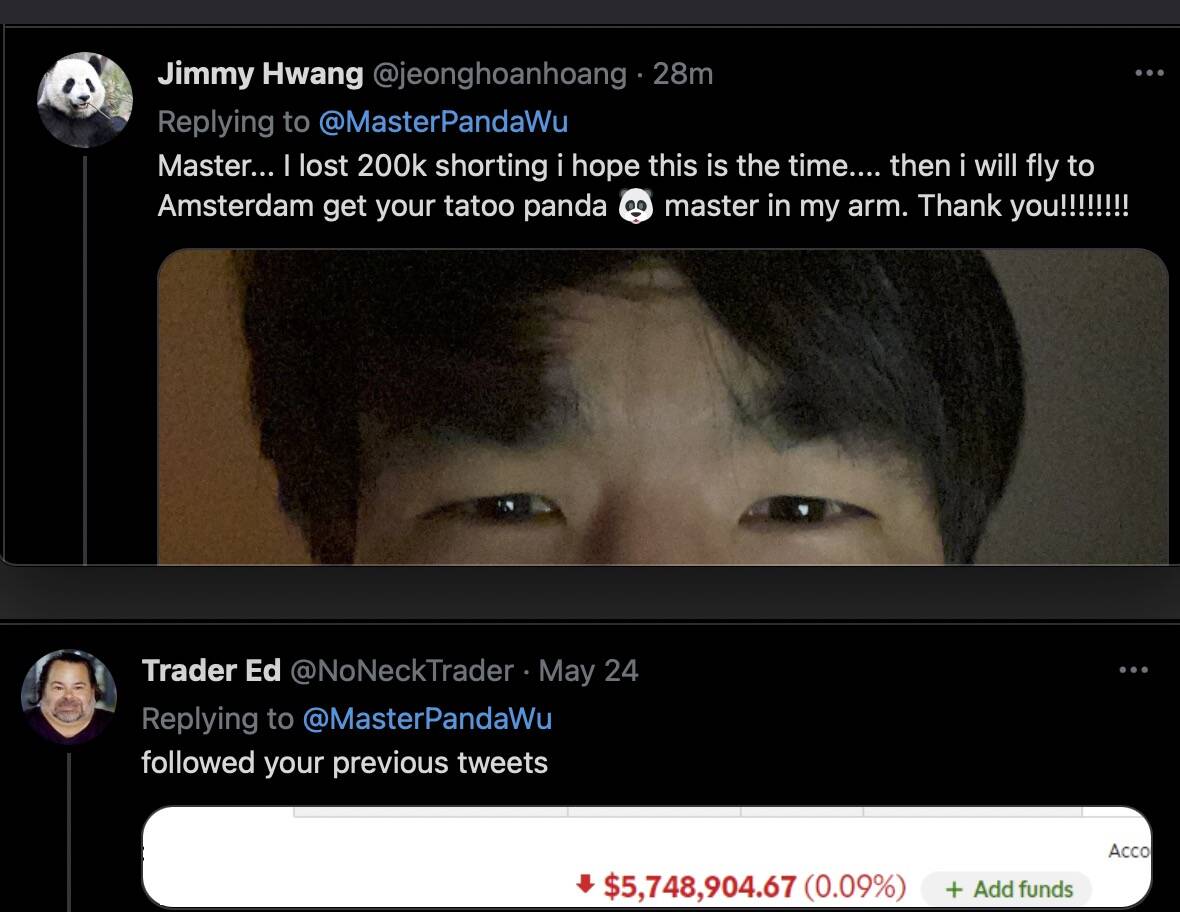
What does it mean to be down 5M but just 0.09%?

2 Likes
It means we are all poor. 
1 Like
.
It means the contract with this billionaire’s friend is on the line. He has up to 2mrw mid day to prove this astro reading is accurate (hope is more accurate than the call that Trump is sure to win)… He can’t use TA because most TA indicators favor a new ATH.

Panda lost his b… dare not all in. Apparently, no more 10% over 3 days decline… just a whimper or even worse, bull run!
.
wave (b) is $420.74, HoD is $420.72 so no forced hibernation yet. If he is right, $420.72 is the best price for day traders to go ALL IN for HUGE gain in a few days. I was in HMART ![]() Now that I’m back, should I spend $50k all in long SPY put (Jun 1/2 ATM)? Can afford to lose that amount? YOLO?
Now that I’m back, should I spend $50k all in long SPY put (Jun 1/2 ATM)? Can afford to lose that amount? YOLO?
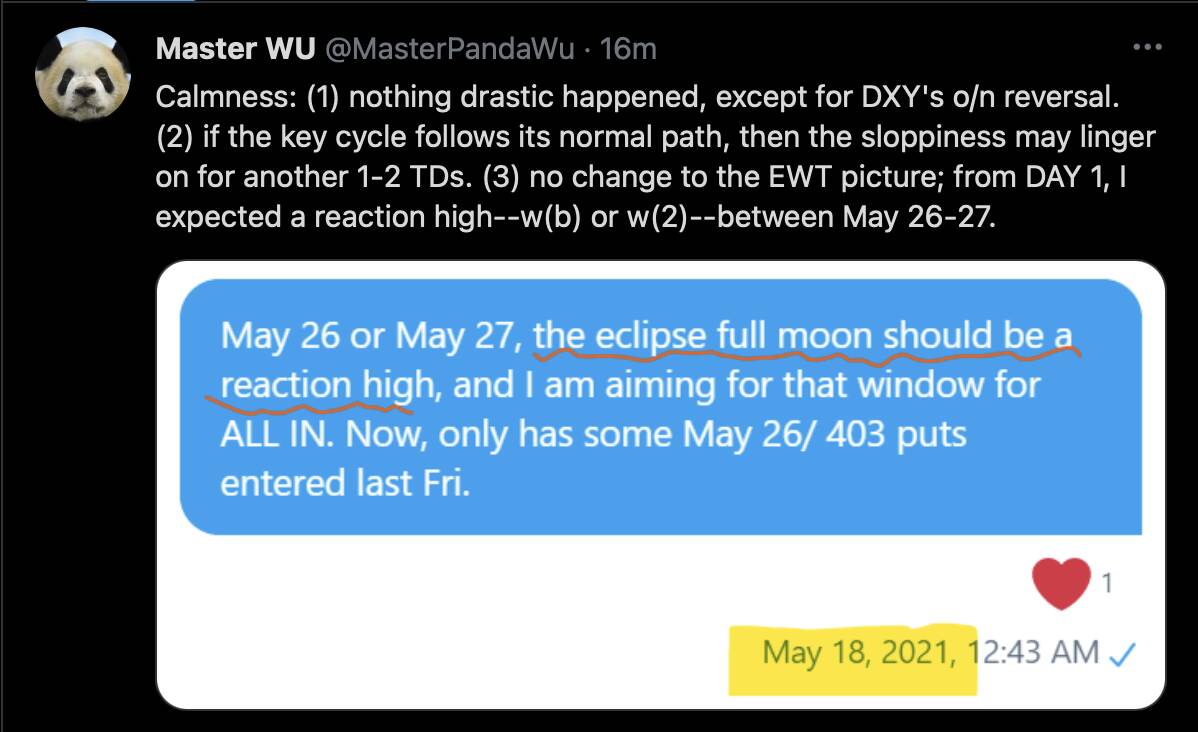
no change to the EWT picture; from DAY 1, I expected a reaction high–w(b) or w(2)–between May 26-27.
Wave (b) SPY 420.74 supposed to be the tip of W-2/W-B Panda was saying where he would go ALL IN (day trading ![]() not MT/LT trading… his term, normal term is position trading/ short-term investing). He doesn’t plan to share this but he is sharing it now… no confidence of it happening or blood moon is affecting him?
not MT/LT trading… his term, normal term is position trading/ short-term investing). He doesn’t plan to share this but he is sharing it now… no confidence of it happening or blood moon is affecting him?
Throw $300 away, Long 10 SPY put(Jun2 $410).
The real cost of following Panda is not just $300. It’s that he blinds you to the opportunities on the long side. F&G is now at 36. I think the risk/reward favors the long side.
.
Don’t be so sure.
Technical indicators like RSI and FGI are ![]()
End of abc is? Could be resumption of the bull rally. Could be wave a or w of a larger corrective wave. Doesn’t matter what it is, should close all (including MT/LT) short position at the end of wave c. The follow-on rally/ counter-trend is usually very impulsive.
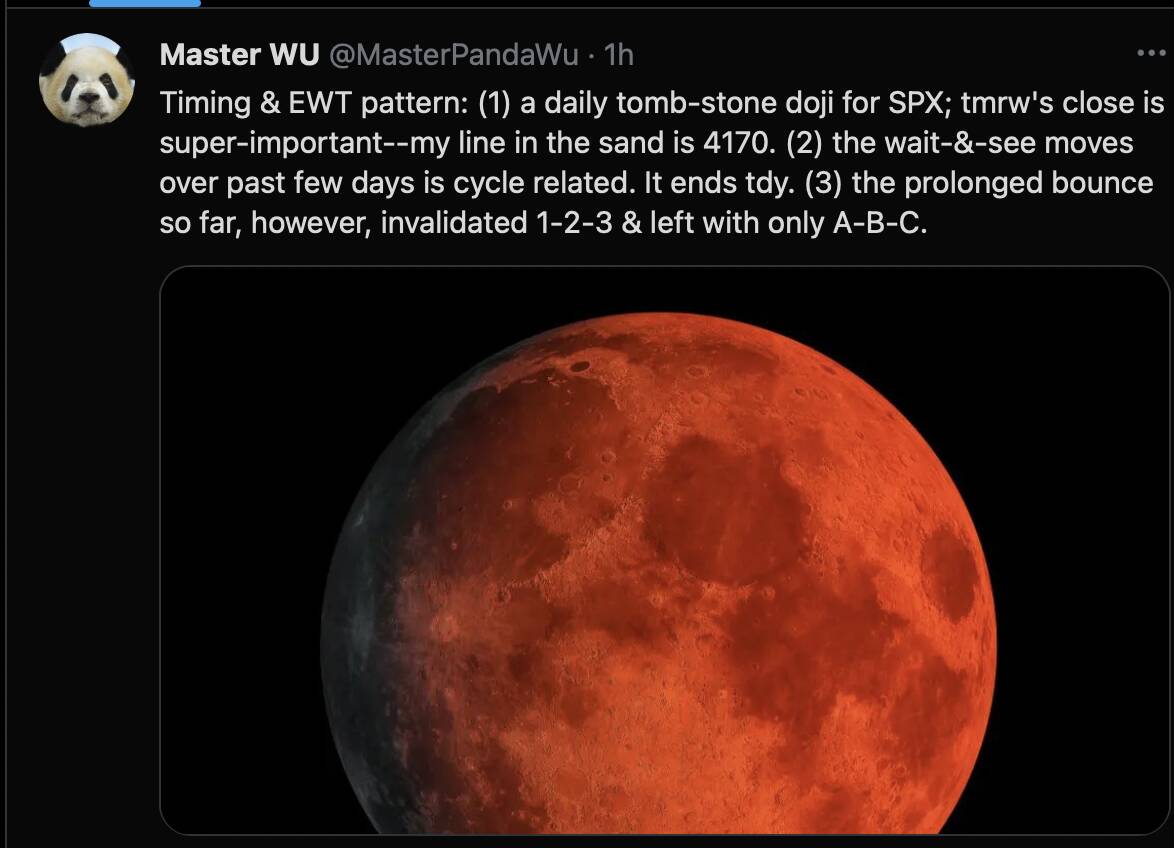
By line in the sand is 4170, my take is he meant if 2mrw doesn’t close below SPX 4170, he would close all his short position… admit defeat.
Just for info, according to Fibonacci time spiral, the turn date is May 28, one day later than what Panda’s cycle/astro indicates.
1 Like
Cough cough voodoo cough cough


Make or break time for Panda.
Btw, while Fibonacci time spiral indicates May 28 is a turn date for SPX/ SPY, the turn date for Nasdaq/ QQQ is Jun 2. Wonder why? Will know next week.
One last thing, because of the slow melt up to recent ATH, Panda said should interpret as abc instead of 123 of an impulse. As far as I know, wave two can retrace nearly 100%, so 123… of an impulse should be more likely than abc? I always wonder whether Panda knows EWT well… anyhoo, he might be thinking abc is a flat and hence a wave four i.e. after c is an up wave the bring SPX to a new ATH.
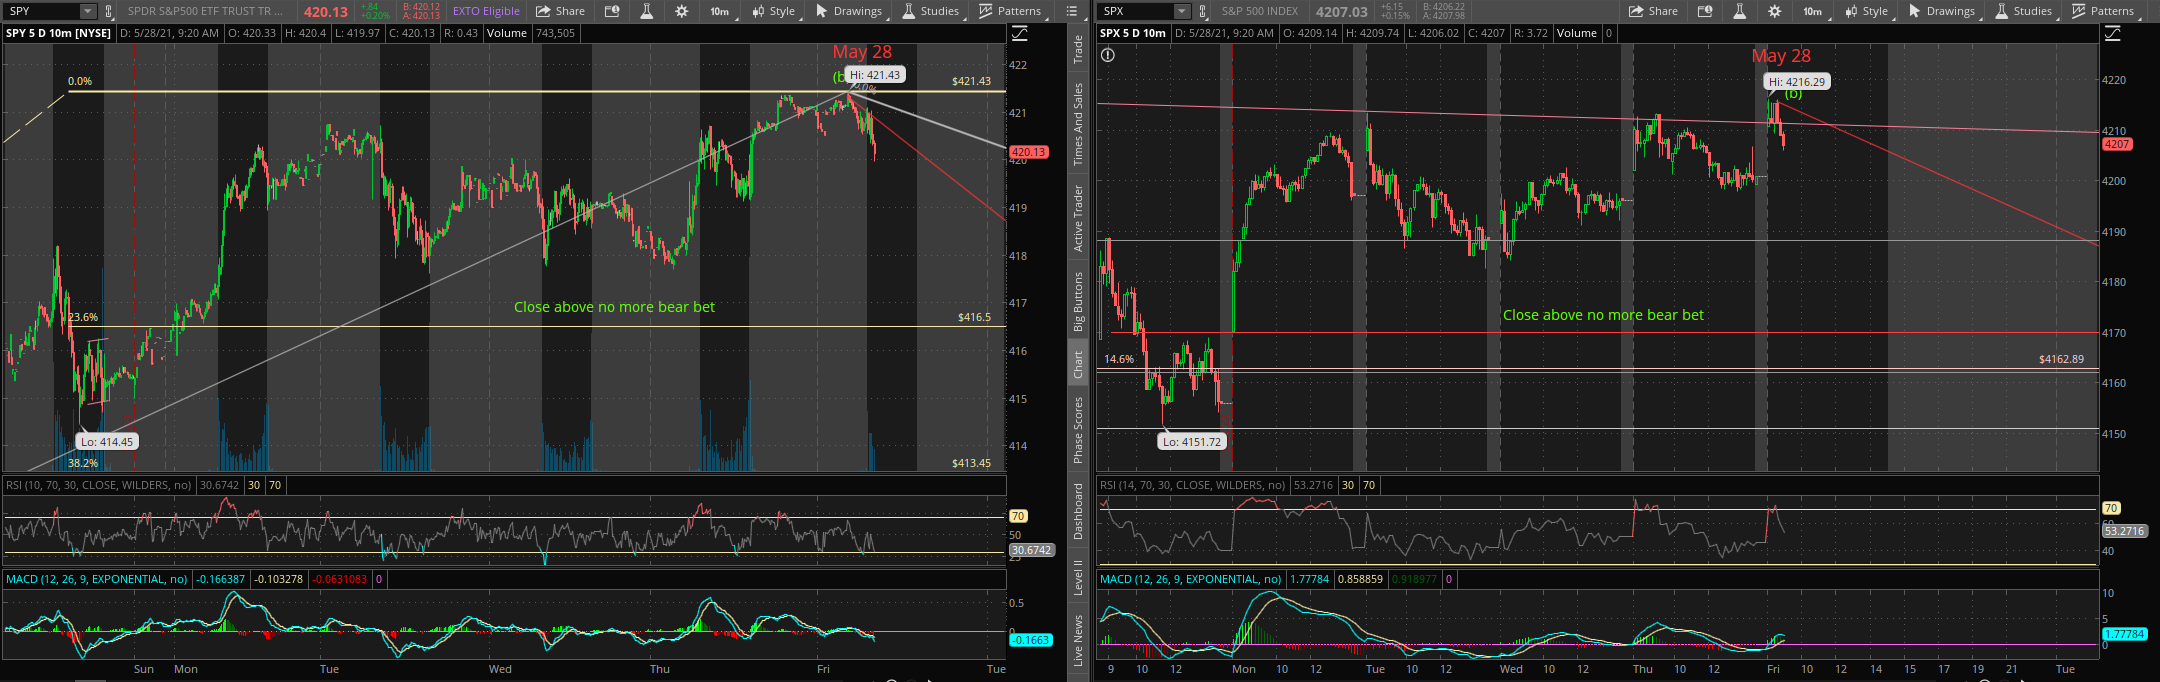
So far indices are volatile, bears and bulls are fighting ferociously… those technicians that don’t use EWT use SPY 420 as the line… currently, SPY is above 420 so bulls are having the upper hand… Panda’s line of the sand, SPX 4170 is equivalent to SPY 416.5… SPY is quite far above… can Panda make it?
…the wait-&-see moves over past few days is cycle related. It ends tdy…
Few days is an understatement. He has been defying what technicals and EW are indicating in favor of the Astrology… has been fixing the waves to be in lined with what the Astro Cycles indicate… it didn’t end yesterday as he thought… today SPX 4170 is the line in the sand that challenge his belief that Astro Cycles trumps TA… btw, TA = technical indicators (e.g. RSI, moving averages,…) + price actions (EWT, chart pattern,…)
1 Like
SPX closed above Panda’s line in the sand SPX 4170… so he has admitted defeat. Astrology is BS.
From price action’s perspective is indecisive, SPY closed ~$420 and QQQ closed below $334.3. Have a good memorial weekend and look forward for a very volatile week.
FIFY.
.
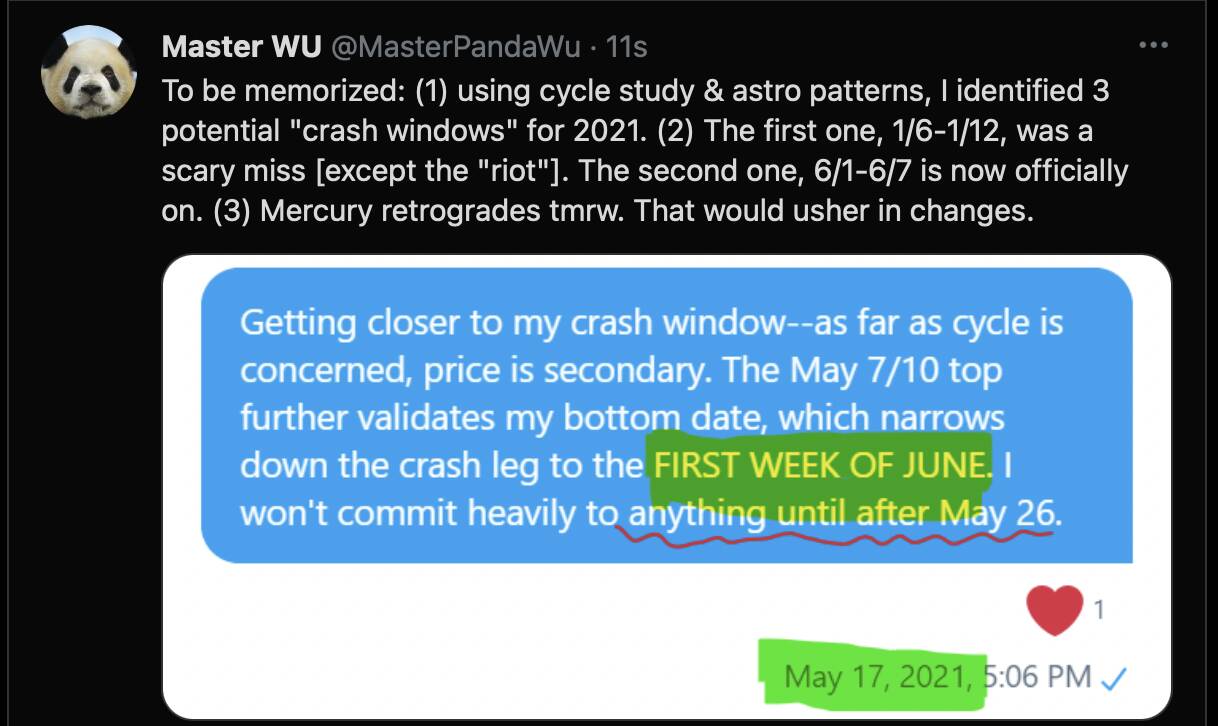
You should do that to Panda’s tweet. SPX 4170 line in the sand is conveniently forgotten. Now the crash window is 6/1-6/7 which is what I said about QQQ… but reader beware, this is the second one, first one is a miss, and there is a third one which mean this could also be a miss… f… I think I better get back to my EWT and price action analysis… enough of Cycle study and astro patterns… I have long ago ruled out technical indicators except for negative divergences. And most annoyingly, he didn’t say whether the 2nd DTK is triggered or not… my suspicion is it wasn’t triggered… DTK is the only indicator I think he has which is very good.
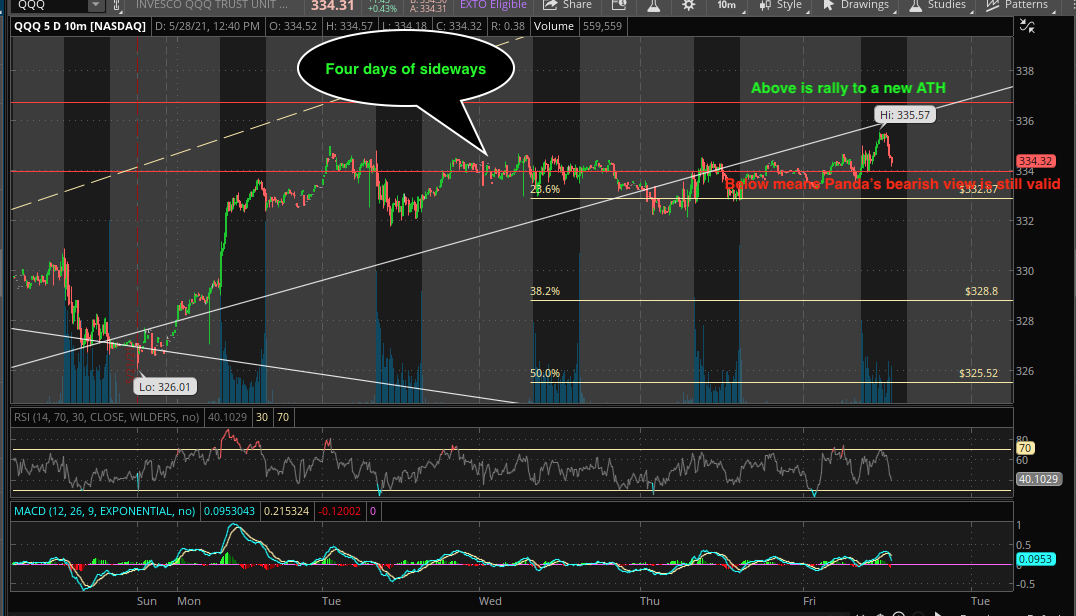
Anyhoo QQQ closed slightly below $334.30 which is bearish.
Nothing in TA can be precise down to two decimal places. Listen to your pal Cramer. Stop flirting with the short side and come join the long party.
BTFD!
334.2886
The safe strategy is to stay in cash and watch. Even if there is a new ATH, it won’t be much higher than recent one. Also might happen during extended hrs or stay there for a short while. CASH is king!
1 Like
Says who?