I do believe this for today. Correction of QQQ is the normal type anyway, drop to the lower degree wave four, I just got over-optimistic.
It is clearly cooked up, 6% drop exactly like year 2017 Jan-Feb period drop. Market went up and up Dec-Jan period which makes all stocks at ATH.
Now, all stocks are BTFD bottom, including TSLA.
TSLA is touched $637 = (888-386)*.5 (50%) + 386 (oct 30) as per EW correction, this has touched $621.
Okay, here is the issue:
If the slide drops today, you can assume it is cooked up.
If the slide goes further down, something wrong (which is not the case).
IMO, slide stops today and recovery tomorrow. In addition, market itself corrected more than sufficient to bring all the ATH stocks to lowest values, see TSLA, AAPL…and any other stocks most of ATHs are corrected higher than normal.
If you do not believe, watch today IXIC slide and watch tomorrow IXIC jump.
If tomorrow (IXIC) jump > today (IXIC) drop, then market recovered. If not, slide continues.
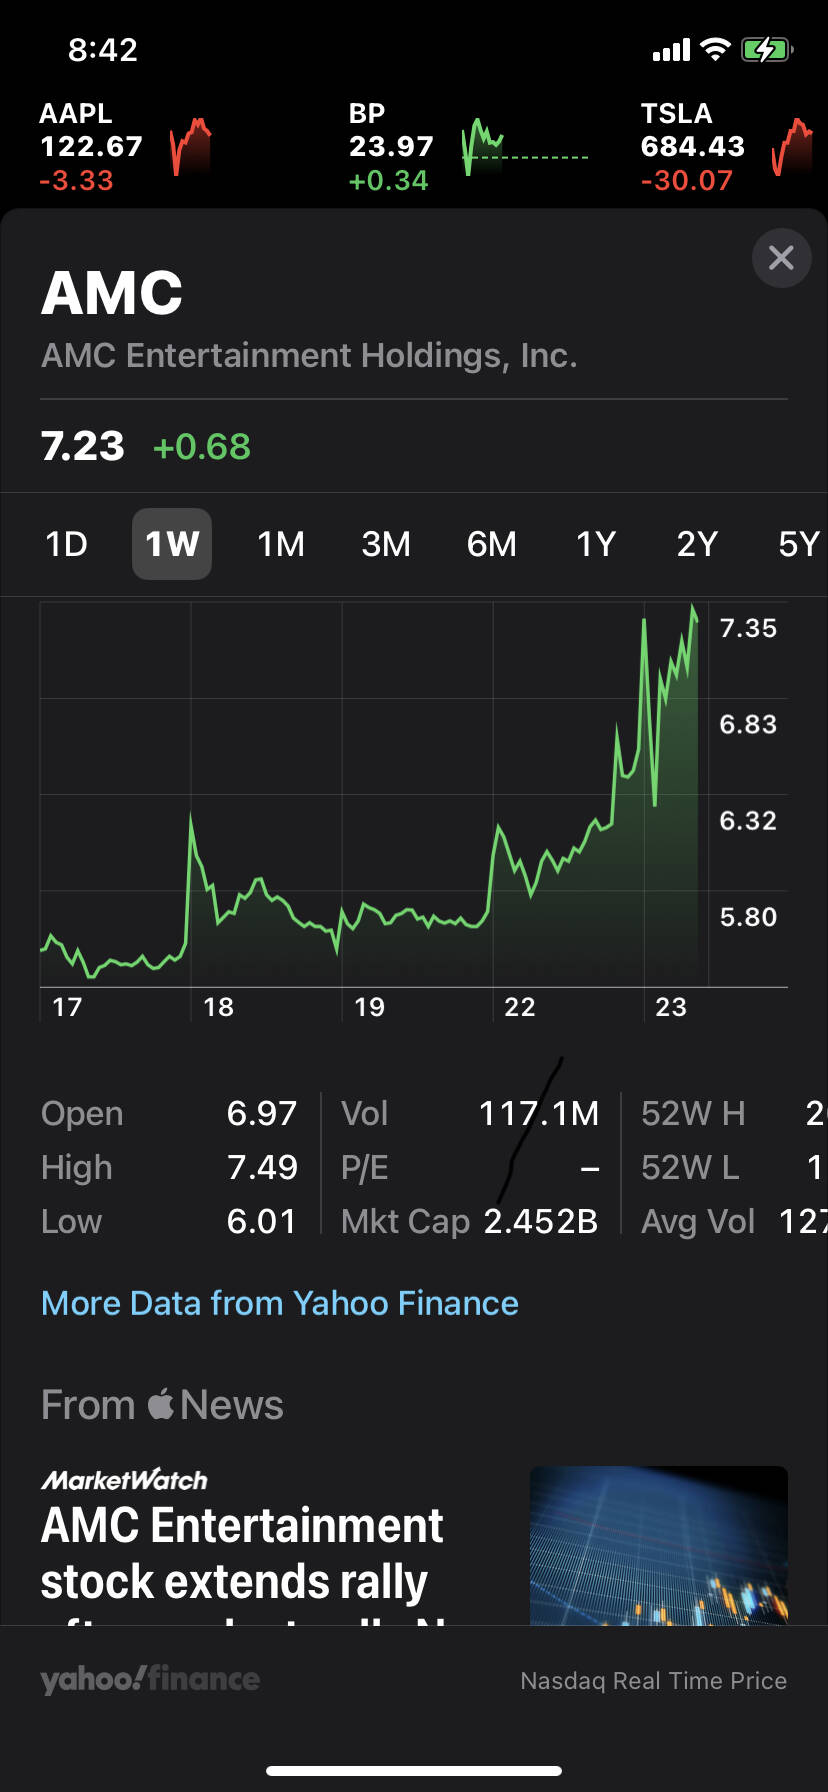
It is my mistake not holding amc stock which I bought $2
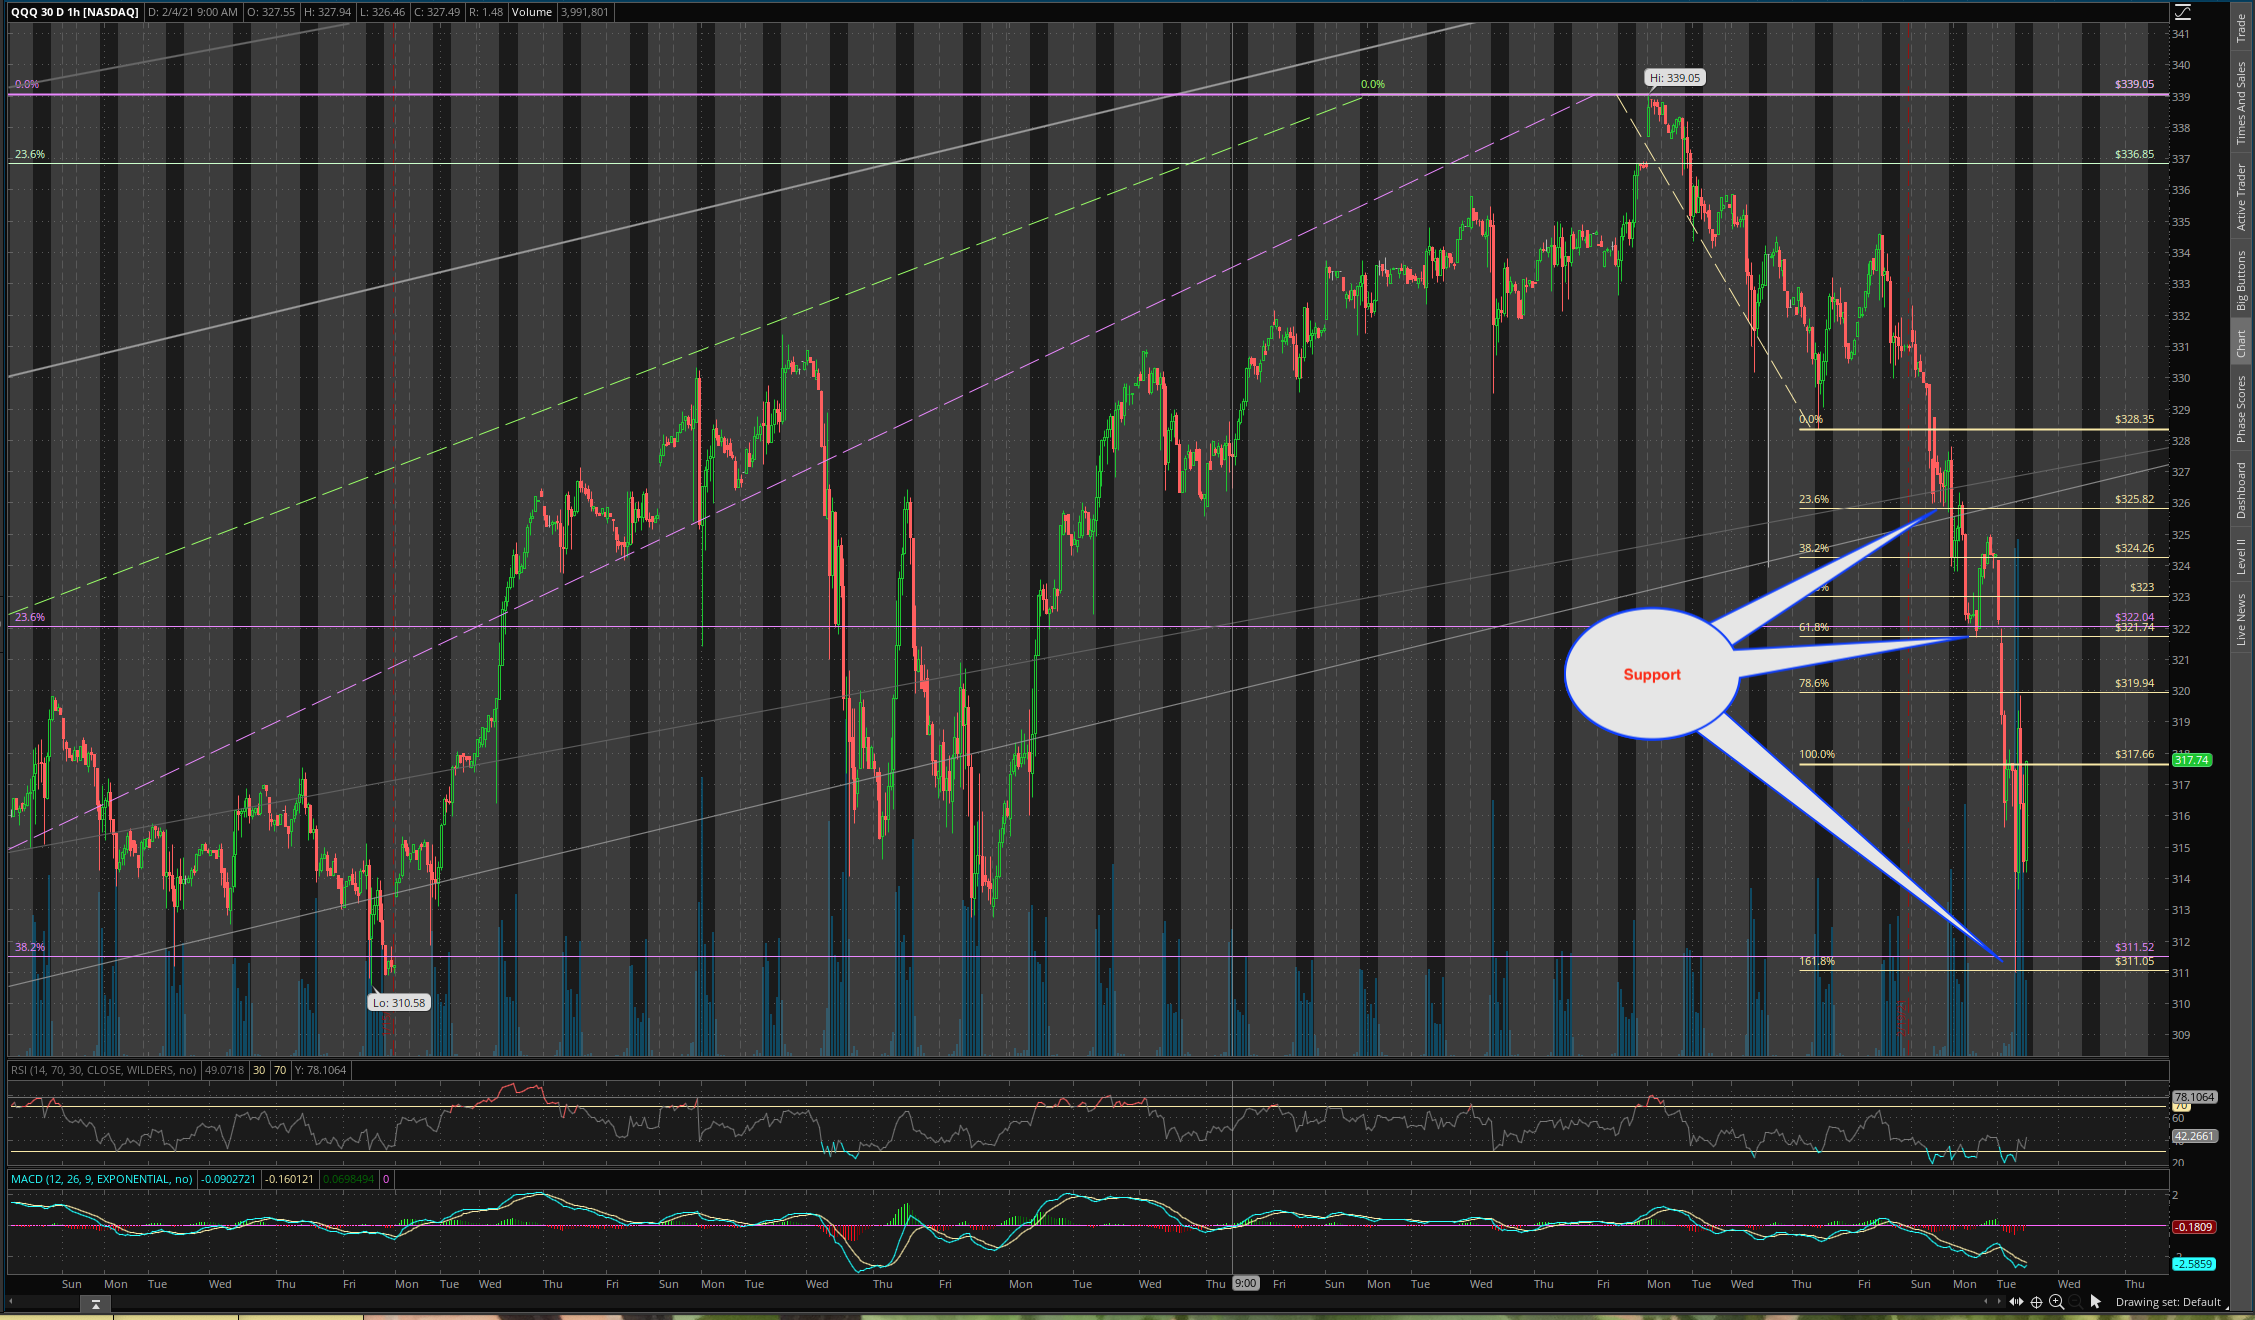
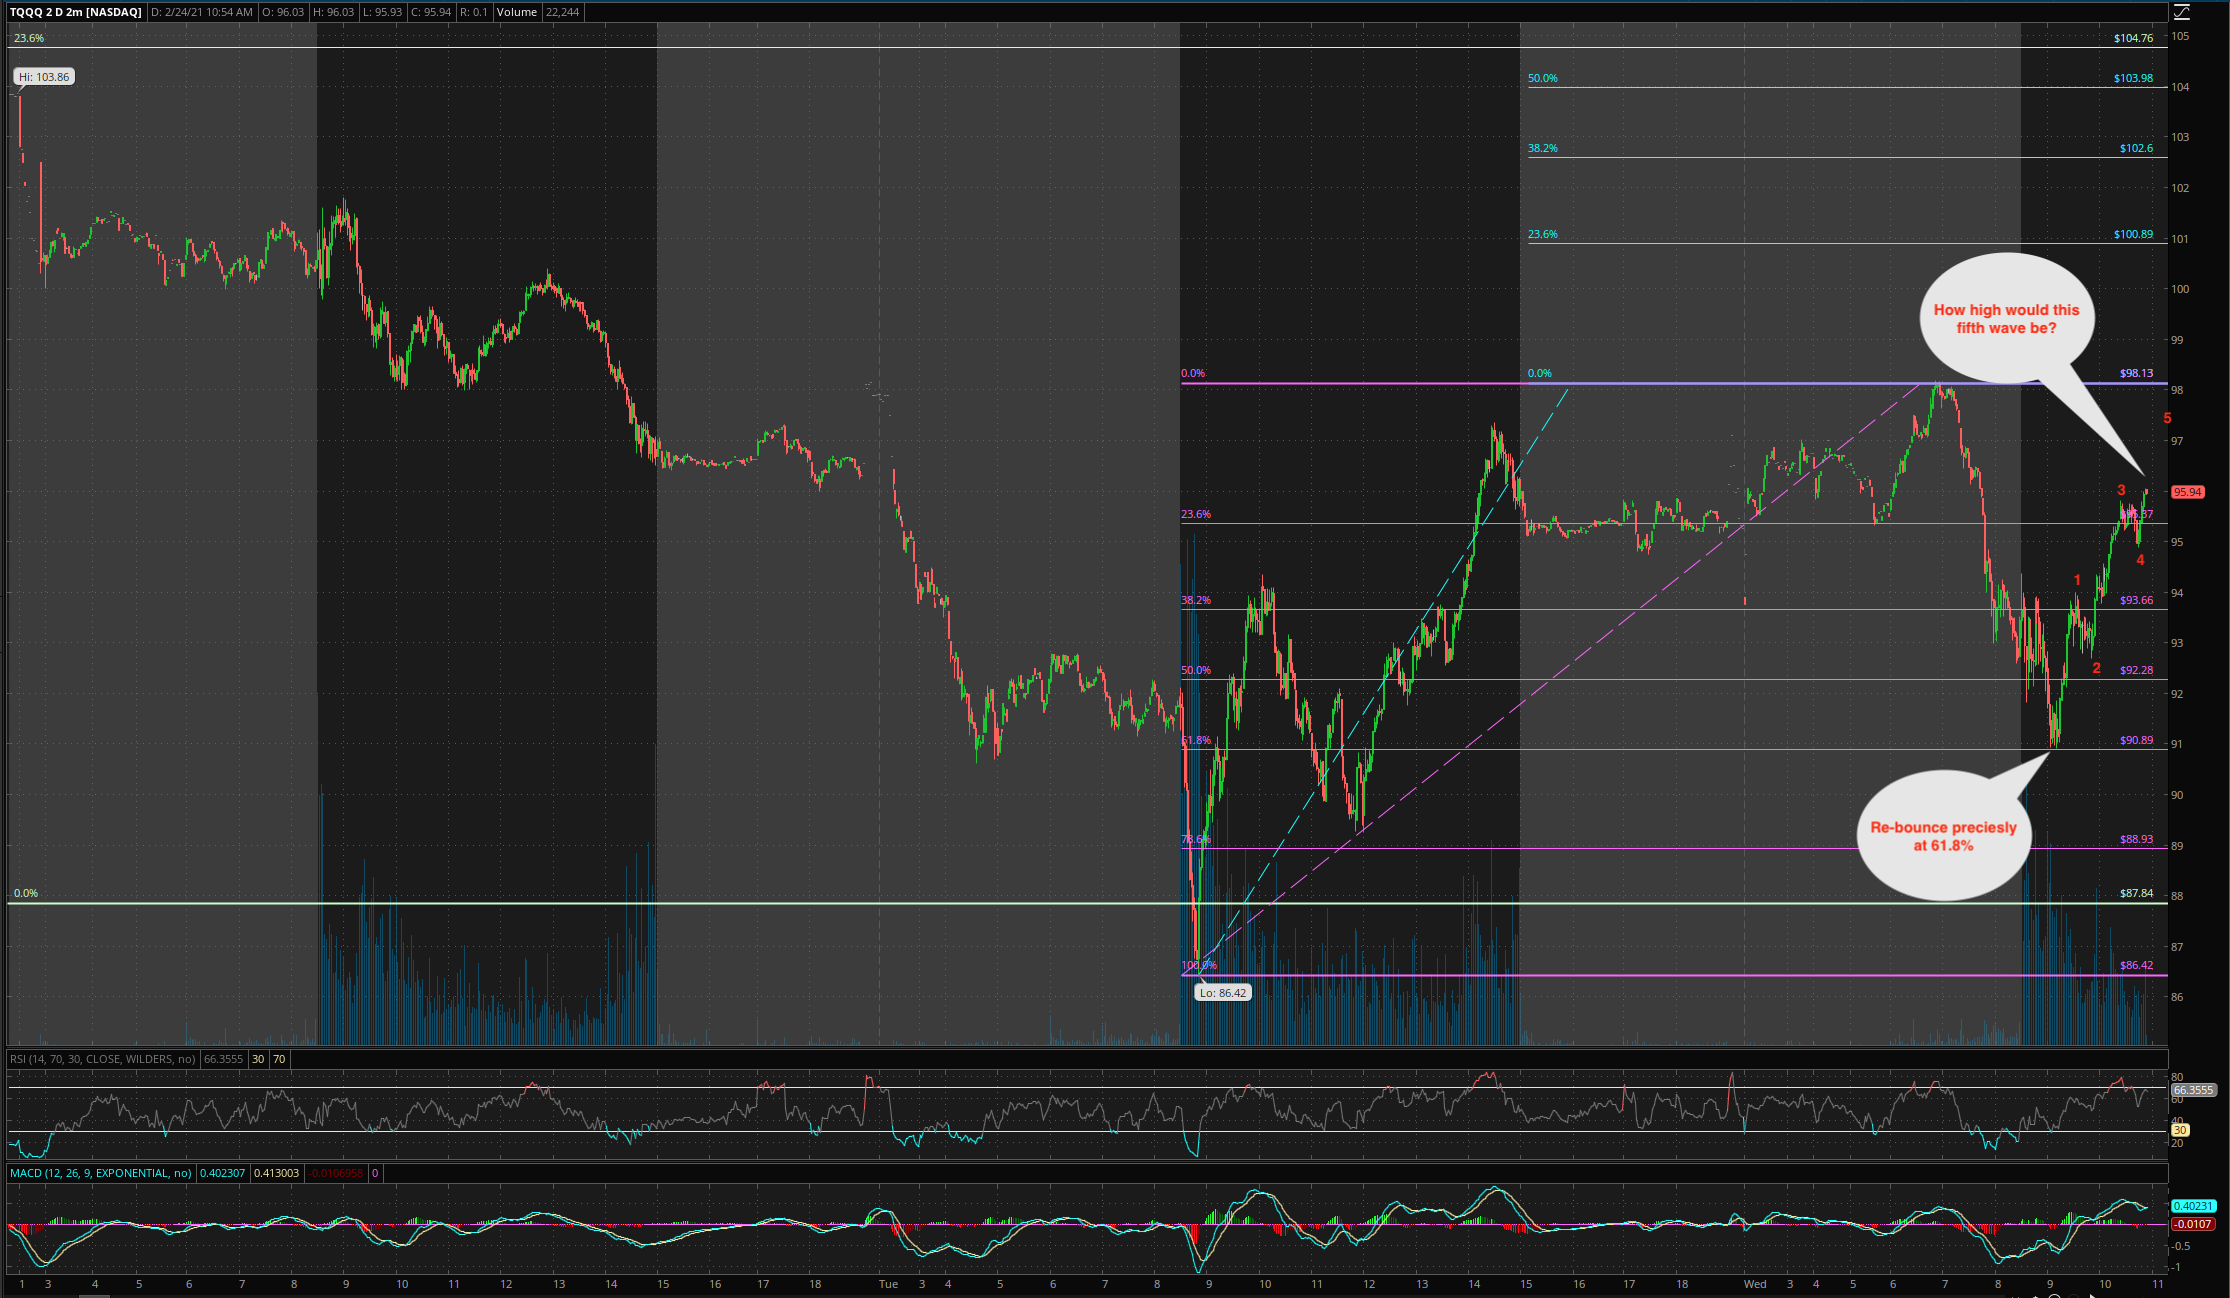
Below is the chart of QQQ which illustrate why I always have problems identifying the right fib ratio, so many fib ratios provide support ![]() and are valid depending on market conditions or shall I say up to market makers to decide
and are valid depending on market conditions or shall I say up to market makers to decide ![]() RSI didn’t provide much clue.
RSI didn’t provide much clue.
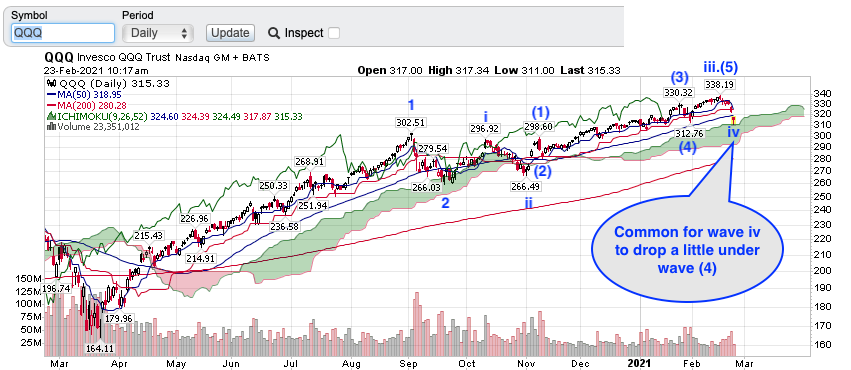
I think is $325 because the price passed 14.6%, min for wave iv correction and the impulse from $312 to $339 is an ending diagonal, common to bottom at wave two of that diagonal… in a raging bull market, it is where wave iv would complete at. After that is 23.6% $322 and then 38.2% $312… lowest so far is $311.05. Wave iv won’t retrace more than 50% unless is an expanding or running flat or a triangle.
Btw, so far, it is a zigzag, rarely completes a wave iv. SO, could be wave a of an expanding flat, running flat or a triangle. Recalled from MRNA running flat, wave b can be higher than wave iii, so going above $339.05 doesn’t mean wave iv is completed. According to literature, expanding flat is the most common but I observe from charts recently, running flat are more common ![]()
True, it is zigzag within a flat range as QQQ (or SPY) grow in-line with economy. We have small 4.2% growth expected and the stocks are made zigzag by market makers.
If you see further, last week only few stocks are low RSI (< 40), now it jumped heavily. In my 400 list of stocks, almost 120 stocks came to buy low level. As I observed already TSLA and AAPL are targeted down to low so that market makers (mainly banks) big up when scared investors are selling.
TSLA adding into SPY was a major issue to bring down the stocks. There was a big post (7-10 days before) explaining what is is happening to TSLA. With 15000% run in last 10 years, they added to SPY now (previously nasdaq). Now, the original fund holders are selling (profit taking) and assigning stocks to public funds like VOO, SPY…etc. This is one time effect now and the TSLA growth going forward pulled/pushed by SPY ETFs. Nice TSLA correction set right everything now.
Only Regret: Had I got this kind of experience and knowledge 20 years before, I would have made nice money! Unfortunately I am getting very, very late in the game!! Yesterday and Today, I am just playing with market very calmly without any disturbance !!!
2 Likes
Opposite to what I feel. Have I known so much, I won’t hold AAPL for so long. Ignorance is bliss for me. It allows me to dumbly hold on to AAPLs for 15 years.
I need a way to figure out which fib numbers market markers want to push or pump it to. RSI works occasionally. May be go to learn how fib time spiral and fib arc work ![]()
TQQQ trading at $93.50, $2.50 more for me to breakeven, very angry with myself acting too rashly ![]() Sell SQQQ too early, buy TQQQ too early, screw up big time in timing… emotions conquer me + EW.
Sell SQQQ too early, buy TQQQ too early, screw up big time in timing… emotions conquer me + EW.
2 Likes
You miss the f… point of the discussion. The idea is to buy TQQQ at that bottom! Allow me to summarize, rather than for you to search through all the posts,
- TQQQ is a dud if QQQ goes sideways
- According to @Jil research, over a 10 year period, only TSLA beats it. Take note TQQQ started in Feb 9, 2010.
- Is impossible to beat TQQQ if you can buy at a MAJOR bottom
Point 3 is what we want to do.
Btw, today is not a major bottom. I bought 1000 TQQQs@$96 (@Zeapelido bought 470@$89) but plan to sell in short order. I want to buy at a major bottom and then sit tight.
2 Likes
Perfectly timing the bottom? We all want to do that. How many actually did? Have you?
Together we can do it ![]() We look at market with different glasses and use different tools.
We look at market with different glasses and use different tools.
Is not a competition amongst us ![]() The goal is to work together to make more money!
The goal is to work together to make more money!
Read two posts up.
1 Like
Okay, try this. Whenever you are buying any stock in future ( say TSLA or SQ ), buy only one TQQQ.
Check the percentage gain after 30 days or 360 days or 90 days or 180 days interval between the stock you picked and the one TQQQ.
If that stock wins longer durations, pick is good.
Presently, I am testing similar approach
1 Like
I would only put in proportion to how big the drop is.
If there is a huge drop, then I will put a lot in. Maybe it stays sideways for a while and not absolute min, but I hopefully avoid any catastrophic drops.
If it never drops that much, then I will never put much in, and that’s okay.
1 Like
This is in my future plan, I will put huge amount in TQQQ at dip and hold long until the next peak.
I am presently testing this kind of solution or approach.
Theoretically it works and I want to see practically too.
1 Like
My statement was a sarcasm. Meaning I think bad things will happen should you choose to do so. Better go all in with a high conviction company than a gambling instrument like this. You will have a higher chance of success with lower risk exposure.
Same with options. Good luck (as in you’d really have to be very lucky) making a lot of money with that.
@manch always remind people of survivorship bias. These things are survivorship bias on steroids. I think only the lottery has worser odds.
1 Like
WAG is to $100.
Fib numbers act naturally as support and resistance, it makes me wonder did those big boys’ algo use fib numbers?
Mostly, they (big banks) do not use this kind of fib numbers as they can not control price levels when they handle billions. They simply use fundamentals, using their own analysis team & software to buy/sell based on portfolio allocation.
All these fib numbers, technical are derived from market action/reaction and will be used by small investors (including multi-millions).
Say, WB wants to buy AAPL at $99, his office will engage brokers and specify a range $95-$99 and the number of shares. It is up to broker’s trading desk (actual traders looking at computers) to buy at that range. Those trading desk people work stressfully 6-8 hours keeping the tab on AAPL price range. They are paid for such service.
BTW: What is WAG?
1 Like
WAG? You are not a millennial? Wild Ass Guess.
2 Likes