manch
1
Redfin: More Home-Sellers are Dropping Their Prices Than in Previous Winters as Buyers Seize More Control of the Market
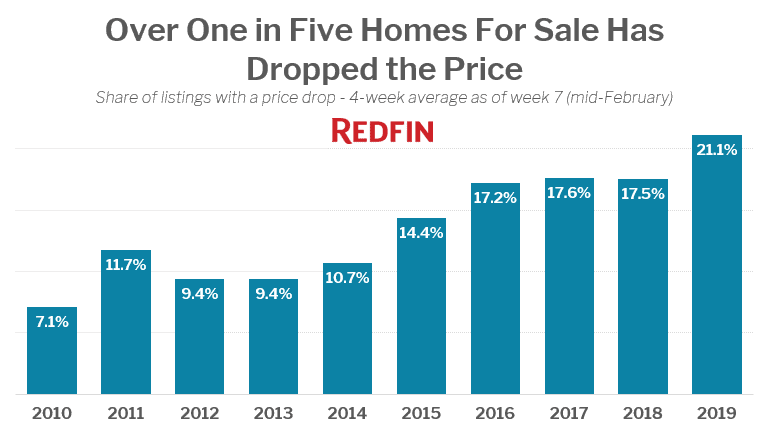
Table: Top 10 Metro Areas with the Largest Share of Homes for Sale with a Price Drop
| Rank |
Metro Area |
Share of Homes for Sale with a Price Drop in the prior 4 Weeks as of Week 7 2019 |
Share of Homes for Sale with a Price Drop in the prior 4 Weeks as of Week 7 2018 |
| 1 |
Fresno, CA |
40.4% |
40.1% |
| 2 |
Tampa, FL |
33.3% |
28.3% |
| 3 |
Indianapolis, IN |
32.4% |
24.9% |
| 4 |
Bakersfield, CA |
31.4% |
30.8% |
| 5 |
Phoenix, AZ |
30.7% |
23.2% |
| 6 |
Cape Coral, FL |
30.2% |
28.5% |
| 7 |
Denver, CO |
29.6% |
19.0% |
| 8 |
Orlando, FL |
28.8% |
21.4% |
| 9 |
Deltona, FL |
27.2% |
25.8% |
| 10 |
Sacramento, CA |
26.6% |
22.3% |
Table: Top 10 Metro Areas with the Largest Increase in the Share of Homes for Sale With a Price Drop
| Rank |
Metro Area |
Percentage Point Increase in Price Drops 2018 to 2019 (Week 7) |
Share of Homes for Sale with a Price Drop in the prior 4 Weeks as of Week 7 2019 |
Share of Homes for Sale with a Price Drop in the prior 4 Weeks as of Week 7 2018 |
| 1 |
Las Vegas, NV |
13.6 |
24.9% |
11.3% |
| 2 |
Seattle, WA |
12.8 |
25.7% |
13.0% |
| 3 |
Albuquerque, NM |
12.2 |
26.5% |
14.3% |
| 4 |
San Jose, CA |
11.1 |
17.9% |
6.8% |
| 5 |
Denver, CO |
10.6 |
29.6% |
19.0% |
| 6 |
Palm Bay, FL |
9.5 |
20.4% |
10.9% |
| 7 |
Atlanta, GA |
9.0 |
22.4% |
13.4% |
| 8 |
Phoenix, AZ |
7.5 |
30.7% |
23.2% |
| 9 |
Indianapolis, IN |
7.5 |
32.4% |
24.9% |
| 10 |
Orlando, FL |
7.4 |
28.8% |
21.4% |
2 Likes