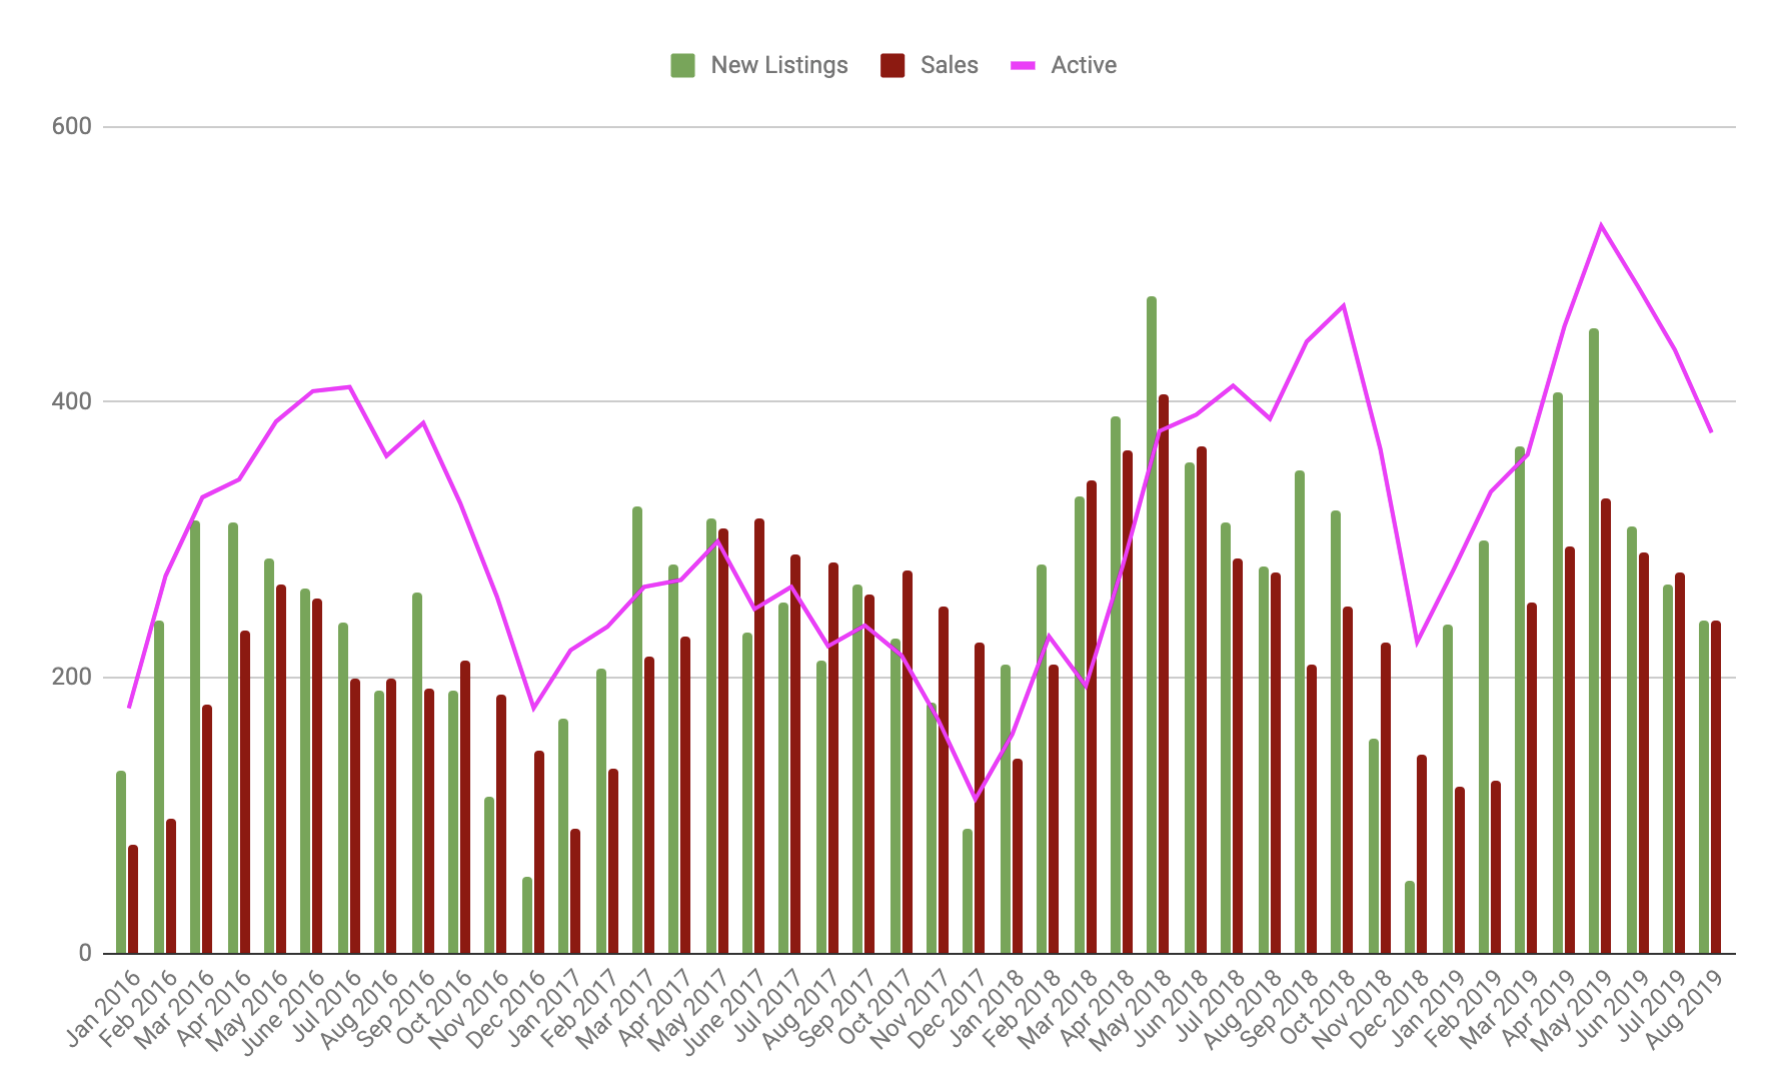
I was just playing with some data and here is the chart for last 3.5 yrs in Santa Clara County - 1.5M to 3M sales price - SFH homes. We got a lot more inventory came out at the end of last year which makes the sale slow early this year, but now not a lot of new inventory is coming. Looks like the higher the inventory, the lower the buyers’ confidence. Human psychology at play here.
Edit: Chart has been edited to reflect active inventory based on the asking price of 1.5M-3M instead of sold.