People are thinking about it incorrectly. They should compare it to the percent of market cap. That’s what the dilution is. If RSU comp is 2% of market cap then operating income needs to increase 2% for EPS to stay flat. Comparing it to other metrics doesn’t reflect how SBC impacts EPS.
Also, SBC comp gets higher when the stock price appreciates. Especially when hire on grants vest over 4 years. There are times when people are vesting 2-3x the target amount in year 3 and 4. Is that bad for shareholders? The stock went up 2-3x in a short time period. That’s amazing for shareholders.
1 Like
.
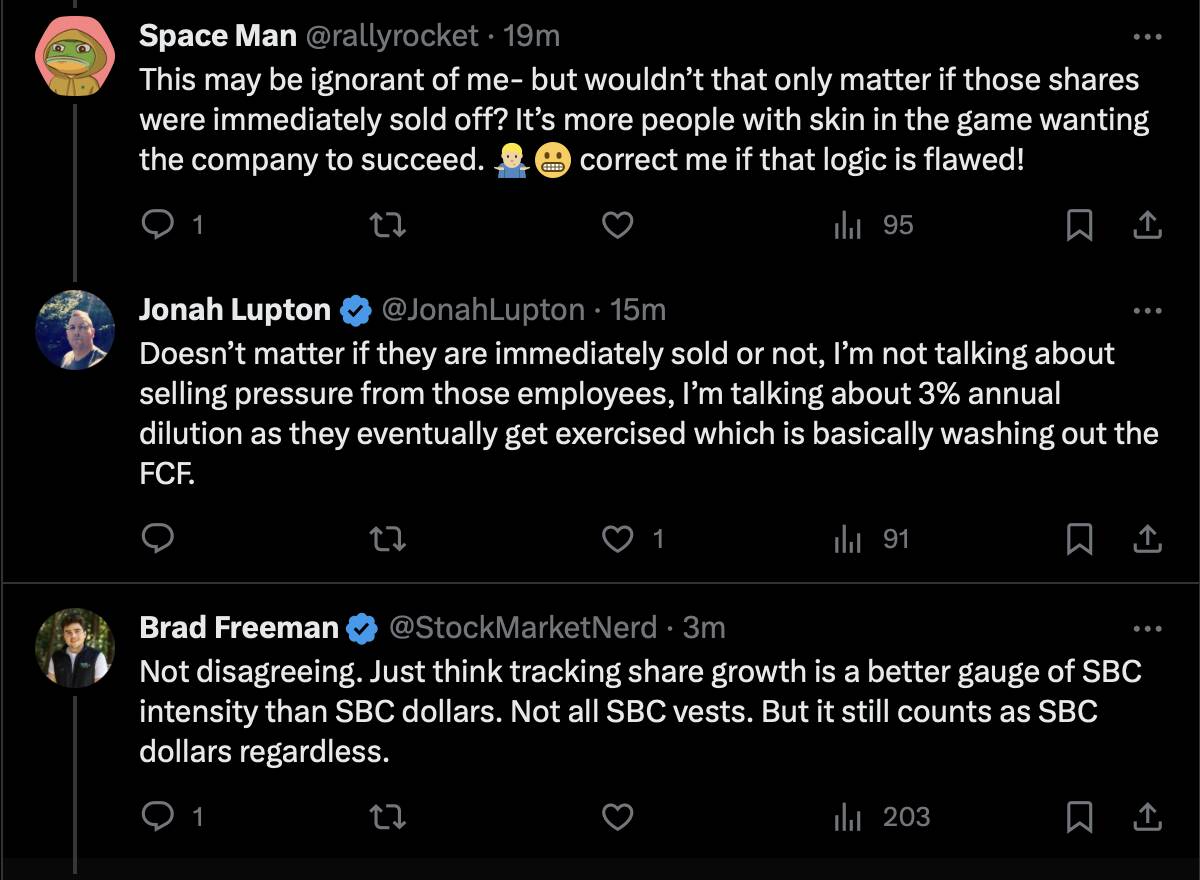
Xer Brad prefers to track share growth… tracking the dilution of ownership. Is my preferred metric because share price and market cap fluctuates a lot… share count doesn’t fluctuate that much.
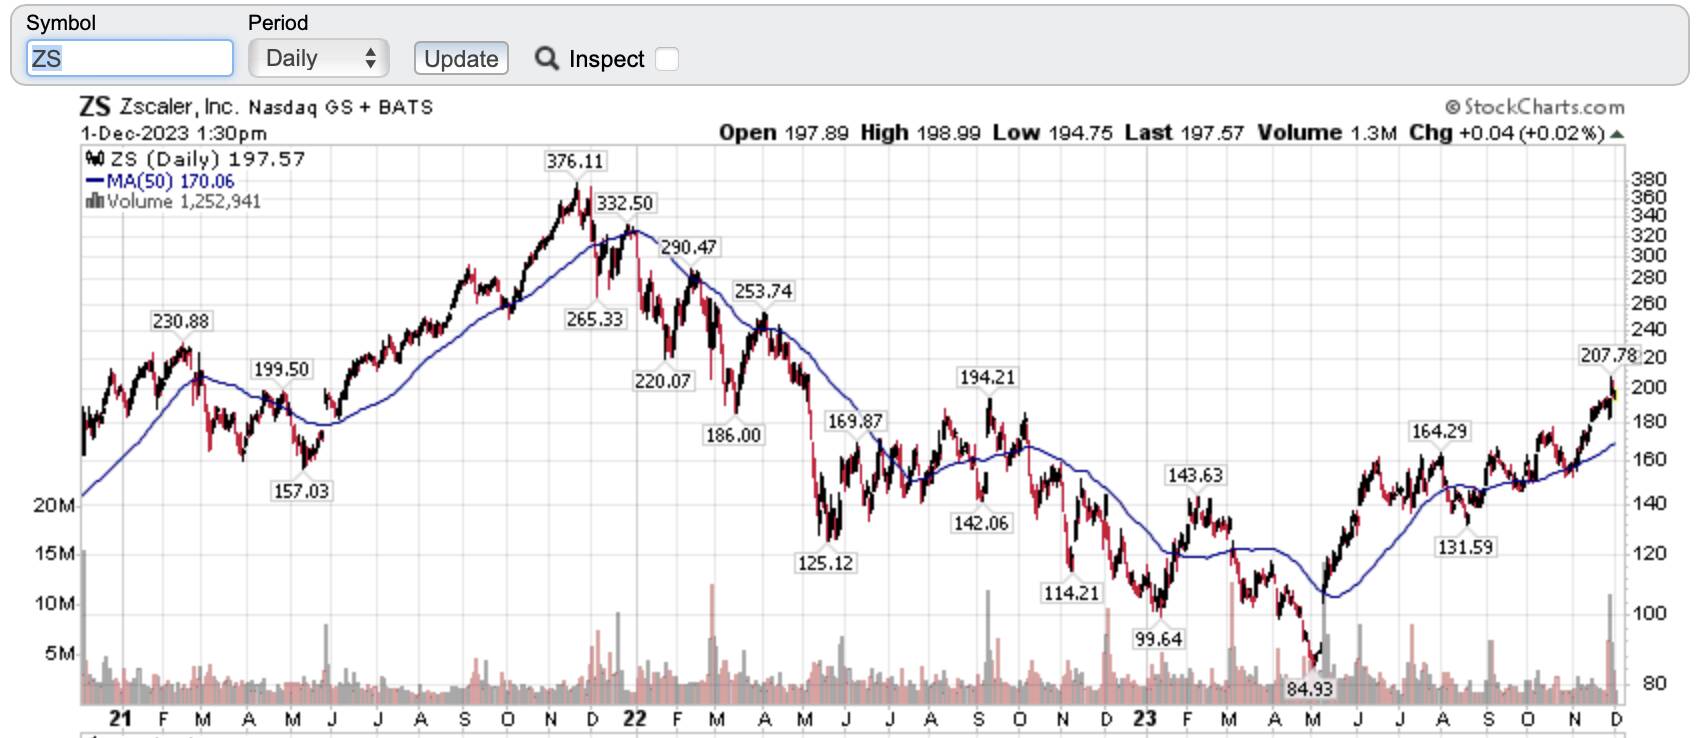
Ofc, no issue for this scenario… when late SJ return, he gave lots of SBC… many investors complain faintly because share price appreciates by leaps and bounds. I believe Jonah is thinking about share price couldn’t increase if SBC is excessive. As of today, many growth stocks are still way below ATH. Using the same example, ZS, currently trading ~50% below ATH. Have the SBC is a lot less, could be at ATH.
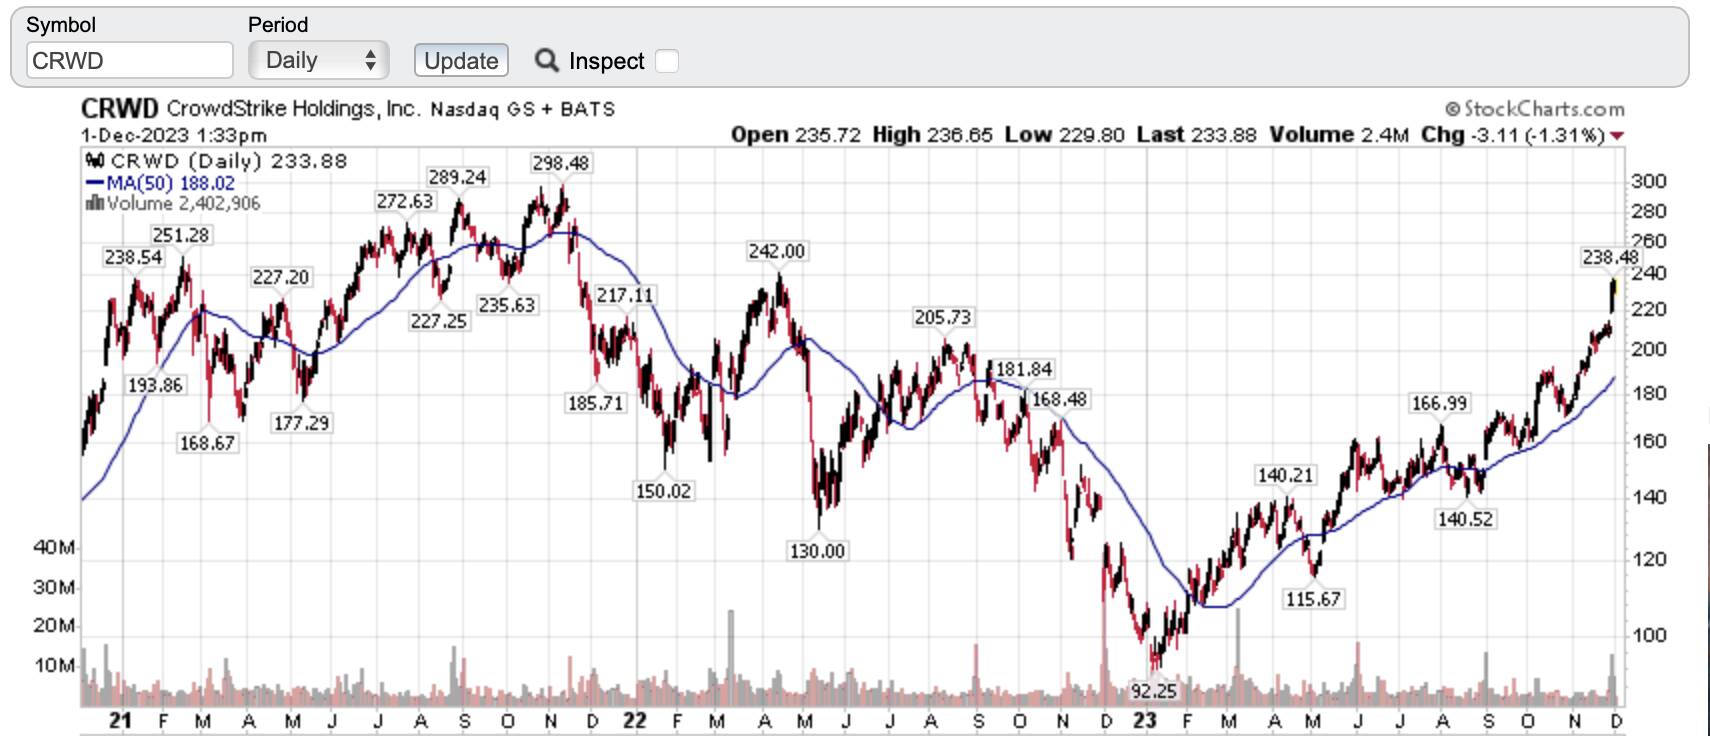
For CRWD which I own, also below ATH by quite a bit… I am in the green because I average down to $160.
Sure, he can track share growth. It’s the same math if taking a snapshot in time. If the number of shares increases by 2%, then operating income needs to increase by 2% for EPS to stay the same.
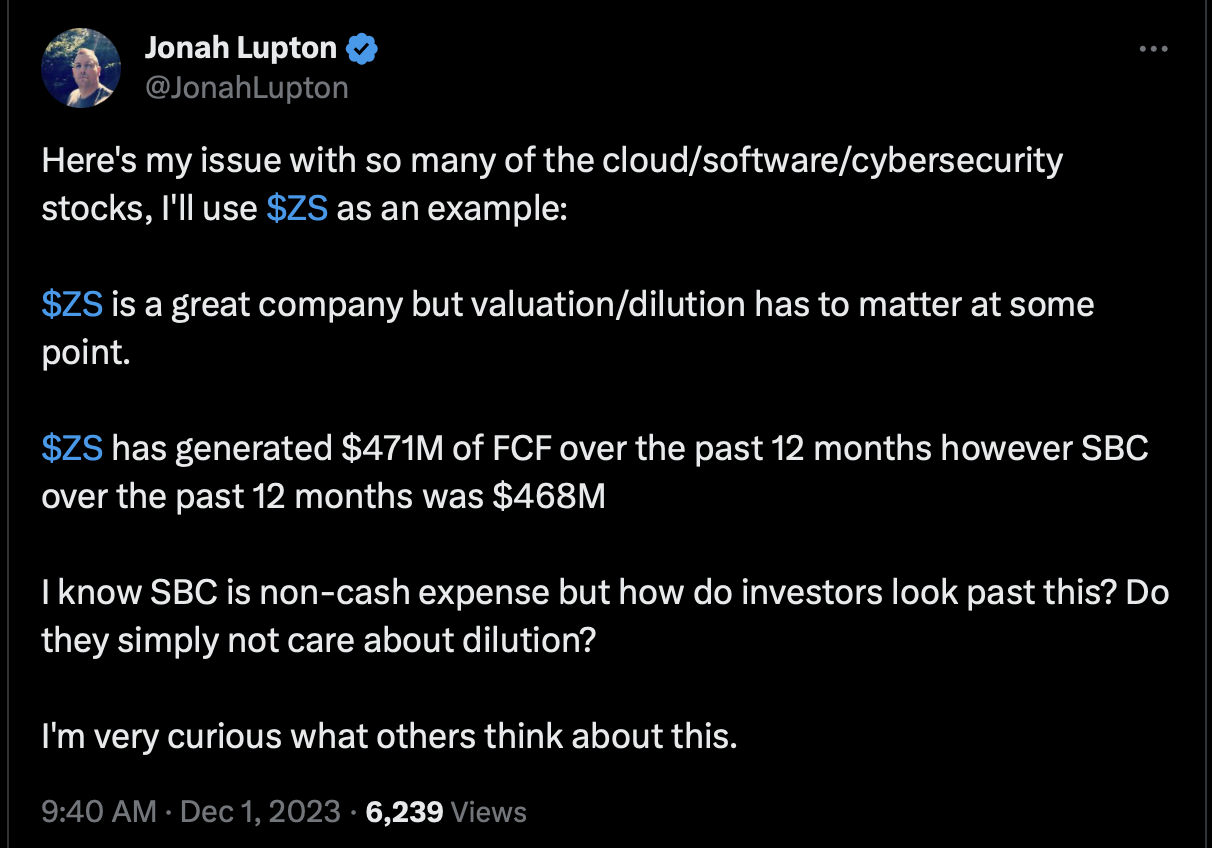
ZS market cap is $29B. Is $0.5B/yr of SBC really keeping the stock from being $58B? The SBC dilution is trivial compared to the market cap. The biggest reason stock prices declined is revenue growth slowed which changes all the EPS forecasts. People are realizing there is a cap to the addressable markets, and companies are closer to them than thought. It’s why companies hit a wall unless they develop additional products.
1 Like