Sonoma County at Inflection Point

https://wolfstreet.com/2018/08/13/housing-market-inflection-point-bay-area-sonoma-county-supply-volume-price/

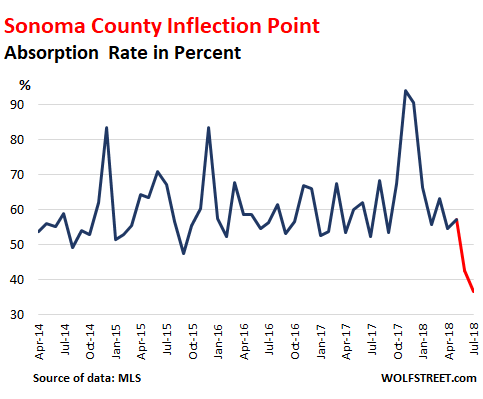
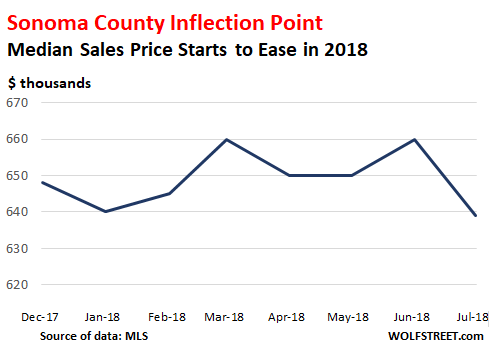
The median price is the last metric to move, and it has met its inflection point in July.

When I talked with Stone a few days ago, he mentioned that the weekly office meetings still focused on how to get sellers to be more realistic. This has now been the case for five weeks in a row. The “vast majority of brokers, except for a few eternal optimists,” expect prices to skid, he said. He expects a 25% correction over the next three years. And the above charts show how it starts at the subcutaneous level, for industry insiders to see, but before it turns into media-ready year-over-year declines in the median price that causes so much wailing and gnashing of teeth.

Canary?

In a housing boom, shock waves radiate outward from Palo Alto as center. In a bust waves travel backward.

It will reach PA in a year or two. :scream:

Gotta pile up cash.

I wish their graphs went back to 2004, so we could see the longer trend. The context vs the bubble and crash is critical.

Absorption rate chart covers 4 years but median price chart only covers 8 months.

This author is not forthright on the longer term data and holding the information for the purpose of his argument.

He could be right that appreciation has ended

1 Like

If appreciation has ended then places like Tahoe with high cap rates should become more attractive…