| RANK | METRO AREA | % LISTINGS WITH PRICE CUT | MEDIAN DAYS ON MARKET | SALE-TO-LIST-PRICE RATIO (%) | MEDIAN HOME VALUE |
|---|---|---|---|---|---|
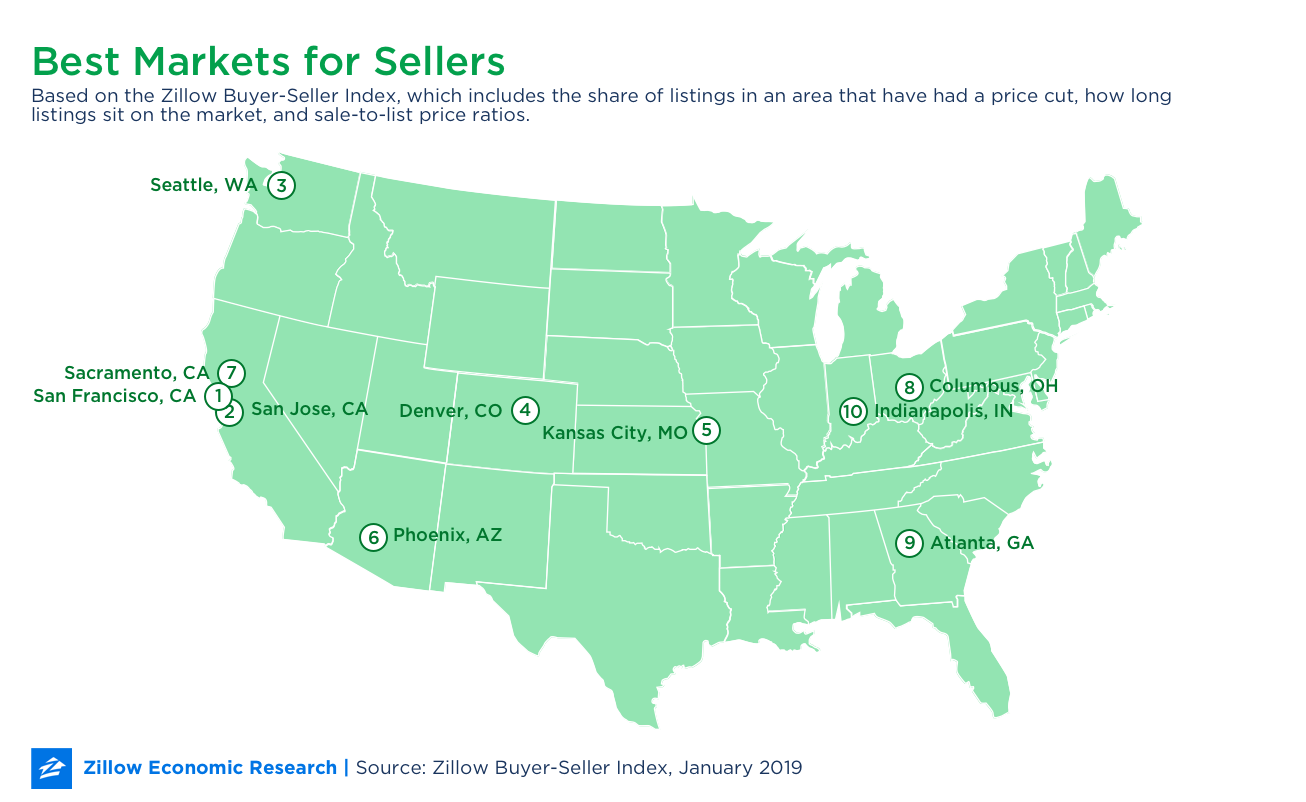
| 1 | San Francisco, CA | 11.5% | 57 | 98.6% | $957,400 |
| 2 | San Jose, CA | 15.3% | 61 | 97.2% | $1,245,800 |
| 3 | Seattle, WA | 15.2% | 77 | 96.6% | $489,700 |
| 4 | Denver, CO | 18.1% | 65 | 97.2% | $405,300 |
| 5 | Kansas City, MO | 14.5% | 66 | 98.2% | $191,600 |
| 6 | Phoenix, AZ | 19.2% | 61 | 97.4% | $264,900 |
| 7 | Sacramento, CA | 17.3% | 67 | 96.9% | $408,700 |
| 8 | Columbus, OH | 16.5% | 71 | 96.6% | $189,900 |
| 9 | Atlanta, GA | 16.1% | 77 | 97% | $217,500 |
| 10 | Indianapolis, IN | 17.9% | 70 | 97% | $163,900 |
| United States | 15.8% | 83 | 96.2% | $225,300 |