Starting a new thread to document the awesome progress we are making in the 20s.
Look at this manufacturing boom happening right now. It is absolutely gorgeous.
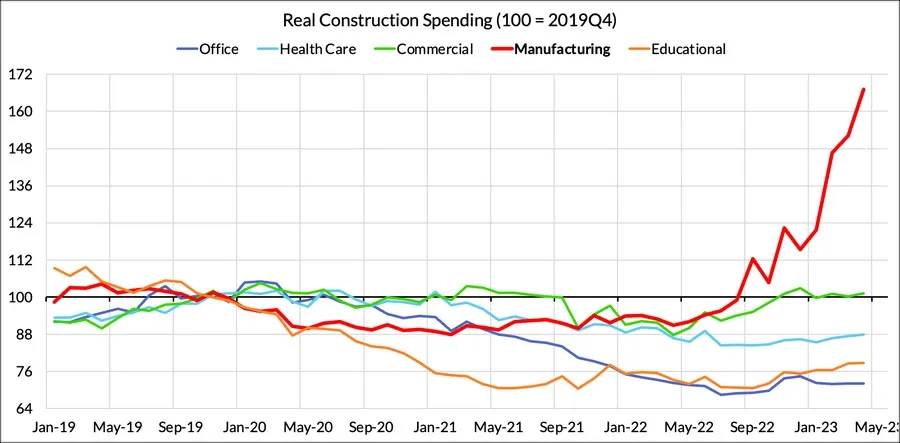
Inflation-adjusted construction spending in the manufacturing industry has absolutely skyrocketed since June 2022, from $90 billion to $189 billion:
That’s an incredible amount. Factory construction spending more than doubled in one year , after being essentially constant for decades. And it perfectly lines up with the passage of the CHIPS Act in July 2022 and the Inflation Reduction Act in August 2022. In fact, big investments by companies like Intel and Ford — making chips and EVs — figure prominently in these numbers.
Massive money printing can give the illusion of growth. In 2008 EU and US debt to GDP both stood at about 65%. Today the EU’s is 85%; ours is 126%.
Remember the late 90’s to late 2000’s’ when emerging markets were all the rage? All sorts of eggheads wrote academic sounding pieces about how they were rocketing ahead of the US. It was all just based on a commodities boom.
That means it’s good use of debt. Using your debt numbers for calculations below.
2008:
EU GDP 16.2T, Debt 10.5T.
US GDP 14.7T, Debt 9.5T
2022:
EU+UK GDP 19.8T, Debt 16.8T. (Assuming same debt ratio for UK and EU.)
US GDP 25T, Debt 31.5T.
What many forgot is that debt is stock but GDP is flow. That means the $31.5T debt is the grand total sum of debt over the years. It’s not going to add another 31T next year. While the GDP number is the annual sum of economic activity. Next year we will have another >25T of economic activity. The year after that etc.
So for the US, debt increased 22T between 2008 and 2022, but annual economic activity increased by over 10T. In other words just in two years the US made enough extra GDP to pay for the extra debt.
Smart investment for the US, while EU pretty much stagnated.
Remember the Mexican debt crisis and the the Asian contagion?
Same old same old. Unsustainable fiscal policies fuel growth which provides the excuse that the policies aren’t really unsustainable. Academics preach structural advantages as reasons for the growth. When it all comes crashing down everyone wonders what they were all thinking.
With all the woke nonsense in our universities it’s hard to believe American education will remain a world standard.
Not all debt are created equal. Most important is whether the debt is put to productive use. In the case of US I would say yes. Evidence in my math above.
USD is also the world’s Number One reserve currency. All our debt is nominated in our own currency and mostly held by Americans. So we owe it to ourselves in money we print. Can you compare America with some poor third world developing countries? No.
Letting public debt grow is a policy choice. We can always tax more to pay down the debt. Congress chose not to. Flip side of public debt is private wealth. That ties back to my first point. Because the debt is producing economic value, it’s just the matter of choosing the government capturing the value and paying down debt, or private citizens and enterprises capturing it and keeping it. We chose the latter.
There are two huge levers to juice our productivity that we haven’t pulled yet.
One is massively building more housing in the most productive part of the country like the Bay Area. The YIMBY movement is looking good but it will take a decade to move the needle.
The other one is immigration. There we can do something overnight and effect will be lighting fast.
“The researchers found this difference between countries has little to do with differences in quality of education, nor is it based on racial discrimination or location, with the persistence of poverty in the US high across racial and geographic lines.”
Well, after visiting Newcastle, England I have some reservations about these conclusions.
Of course that rather desolate landscape did give birth to Ridley Scott and Sting.