Black Panda is converging with Red Panda?
Notice Panda is talking like me, giving possibilities? There are many valid counts, some bullish, some bearish, you have to choose one as preferred, choose one as alternate and bear in mind of other valid counts. With experience and various techniques such as RSIs, channeling, pitchfork, Bollinger bands, Cycles? Astro?.. you can improve your hit rate of which is the “correct” preferred count.
Disclosure: Didn’t look at market for the whole day. Traveled a long distance and wait a long time to get the vaccine 1st shot (PFE/BNTX). 2nd shot is 21-30 days later. So far so good, no side effect. Anyhoo, according to the CDC website, side effect is mostly after the 2nd shot.
Congrats! I thought you didn’t want to get the vaccine? Wife pressure?
Yes. She is FOMOed by her friends and relatives. I am supposed to be Phase 1b (60 + chronic), now mixed with Phase 1c folks (above 50).
Looks like your wife saved your ass, yet again.

That’s true. She was my maid in my last life as lord. Her reward for saving me then is to be my wife in this life  Have to admit, without her lucky streaks, I’ll still be staying in a HDB 5 room in Singapore.

1 Like
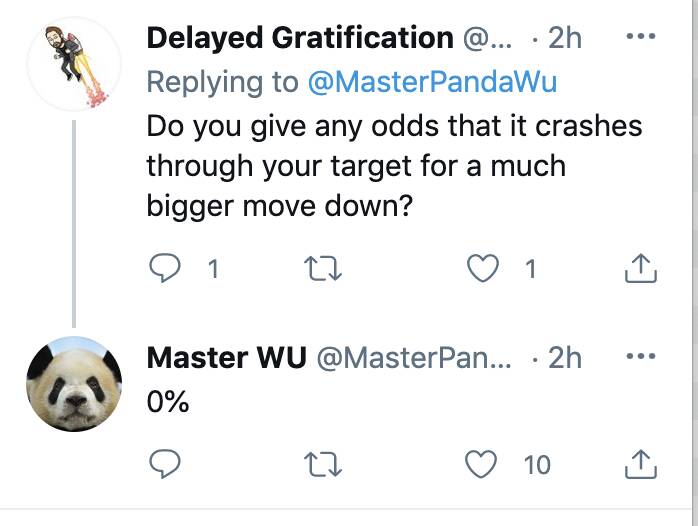
It’s Marko vs Panda now. Marko said 4400 SPX by year end. Panda said crash after peaking in May.

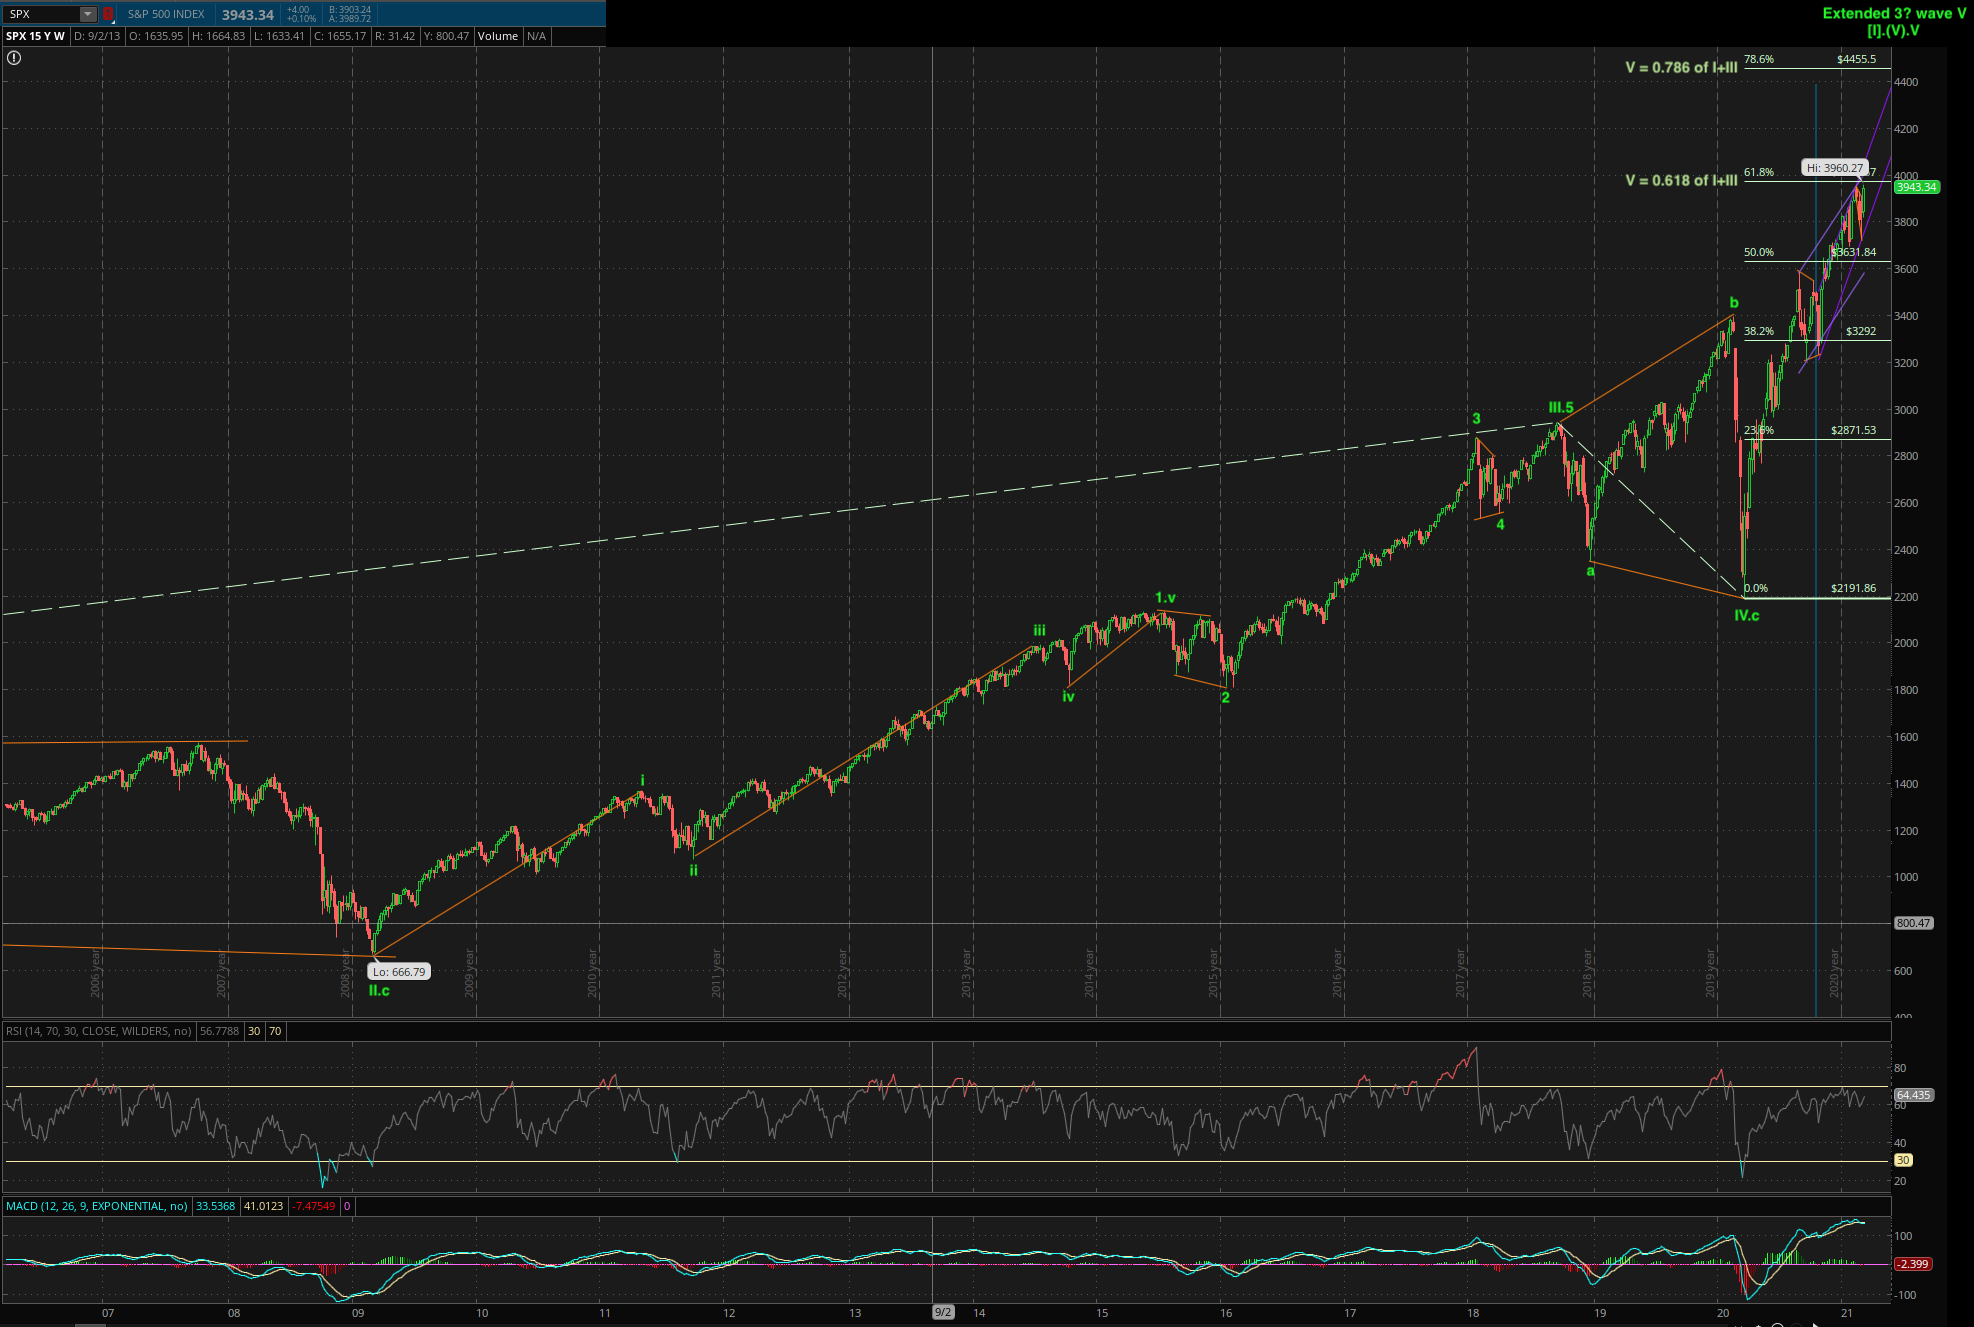
He read this forum? I posted this count. Can’t find my chart… so I post my 15 years weekly chart (not updated) here again…
Max for SPX before a crash is 4455 (max), 3971 (min) - overshot already, when has not worked out ![]() Crash to where (bottom)? Those congestion area where I have green labels are possible bottoms… my guess should be Mar 2020 low… could be less or worse…
Crash to where (bottom)? Those congestion area where I have green labels are possible bottoms… my guess should be Mar 2020 low… could be less or worse…
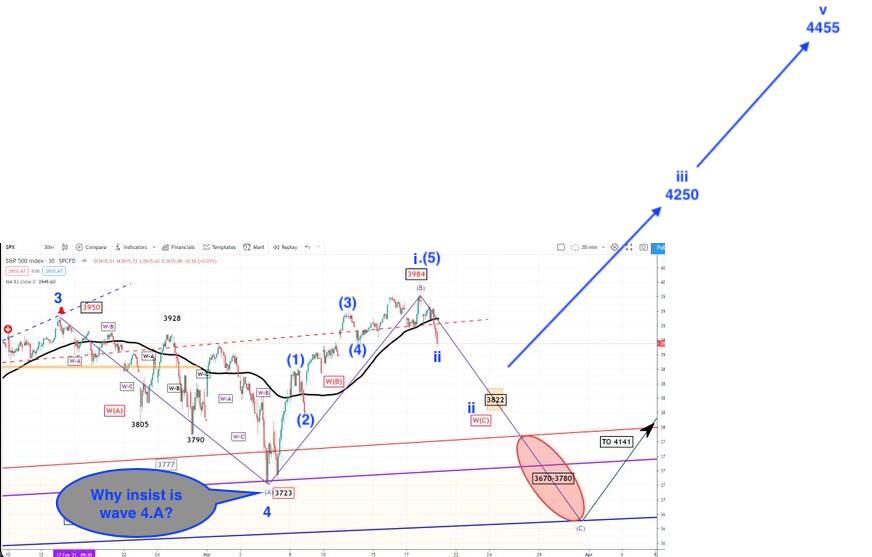
Examine Panda chart in detail. Notice his lower degree labels are identical to my count, the difference is he labeled 3723 as wave 4.a (my notation, his is W(A)) whereas I labeled as wave 4 i.e. wave 4 has completed. I counted five waves (1)(2)(3)(4)(5) from 3723 to 3984, hence that should be an impulse, hence I labeled as wave i. He labeled as wave 4.b (using my notation, his is W(B)), so he must have counted three waves structure. Because of this difference, my count means SPX won’t drop below 3723 ![]() since wave ii can’t retrace more than the length of wave i. I added my count in blue to his chart… my count is definitely bullish
since wave ii can’t retrace more than the length of wave i. I added my count in blue to his chart… my count is definitely bullish ![]() I presume Marko also uses EWT and see the same picture as I.
I presume Marko also uses EWT and see the same picture as I.
IMPORTANT: Please note that wave ii may or may not have completed. I don’t have a Bottom fisher indicator to identify the bottom… apparently identifying bottom is difficult… neither Panda nor @Jil’s algo is able to do that.
Black Panda vs Red Panda. Which one wins?

1 Like
Essentially changing 1 in yellow to (1) in green.
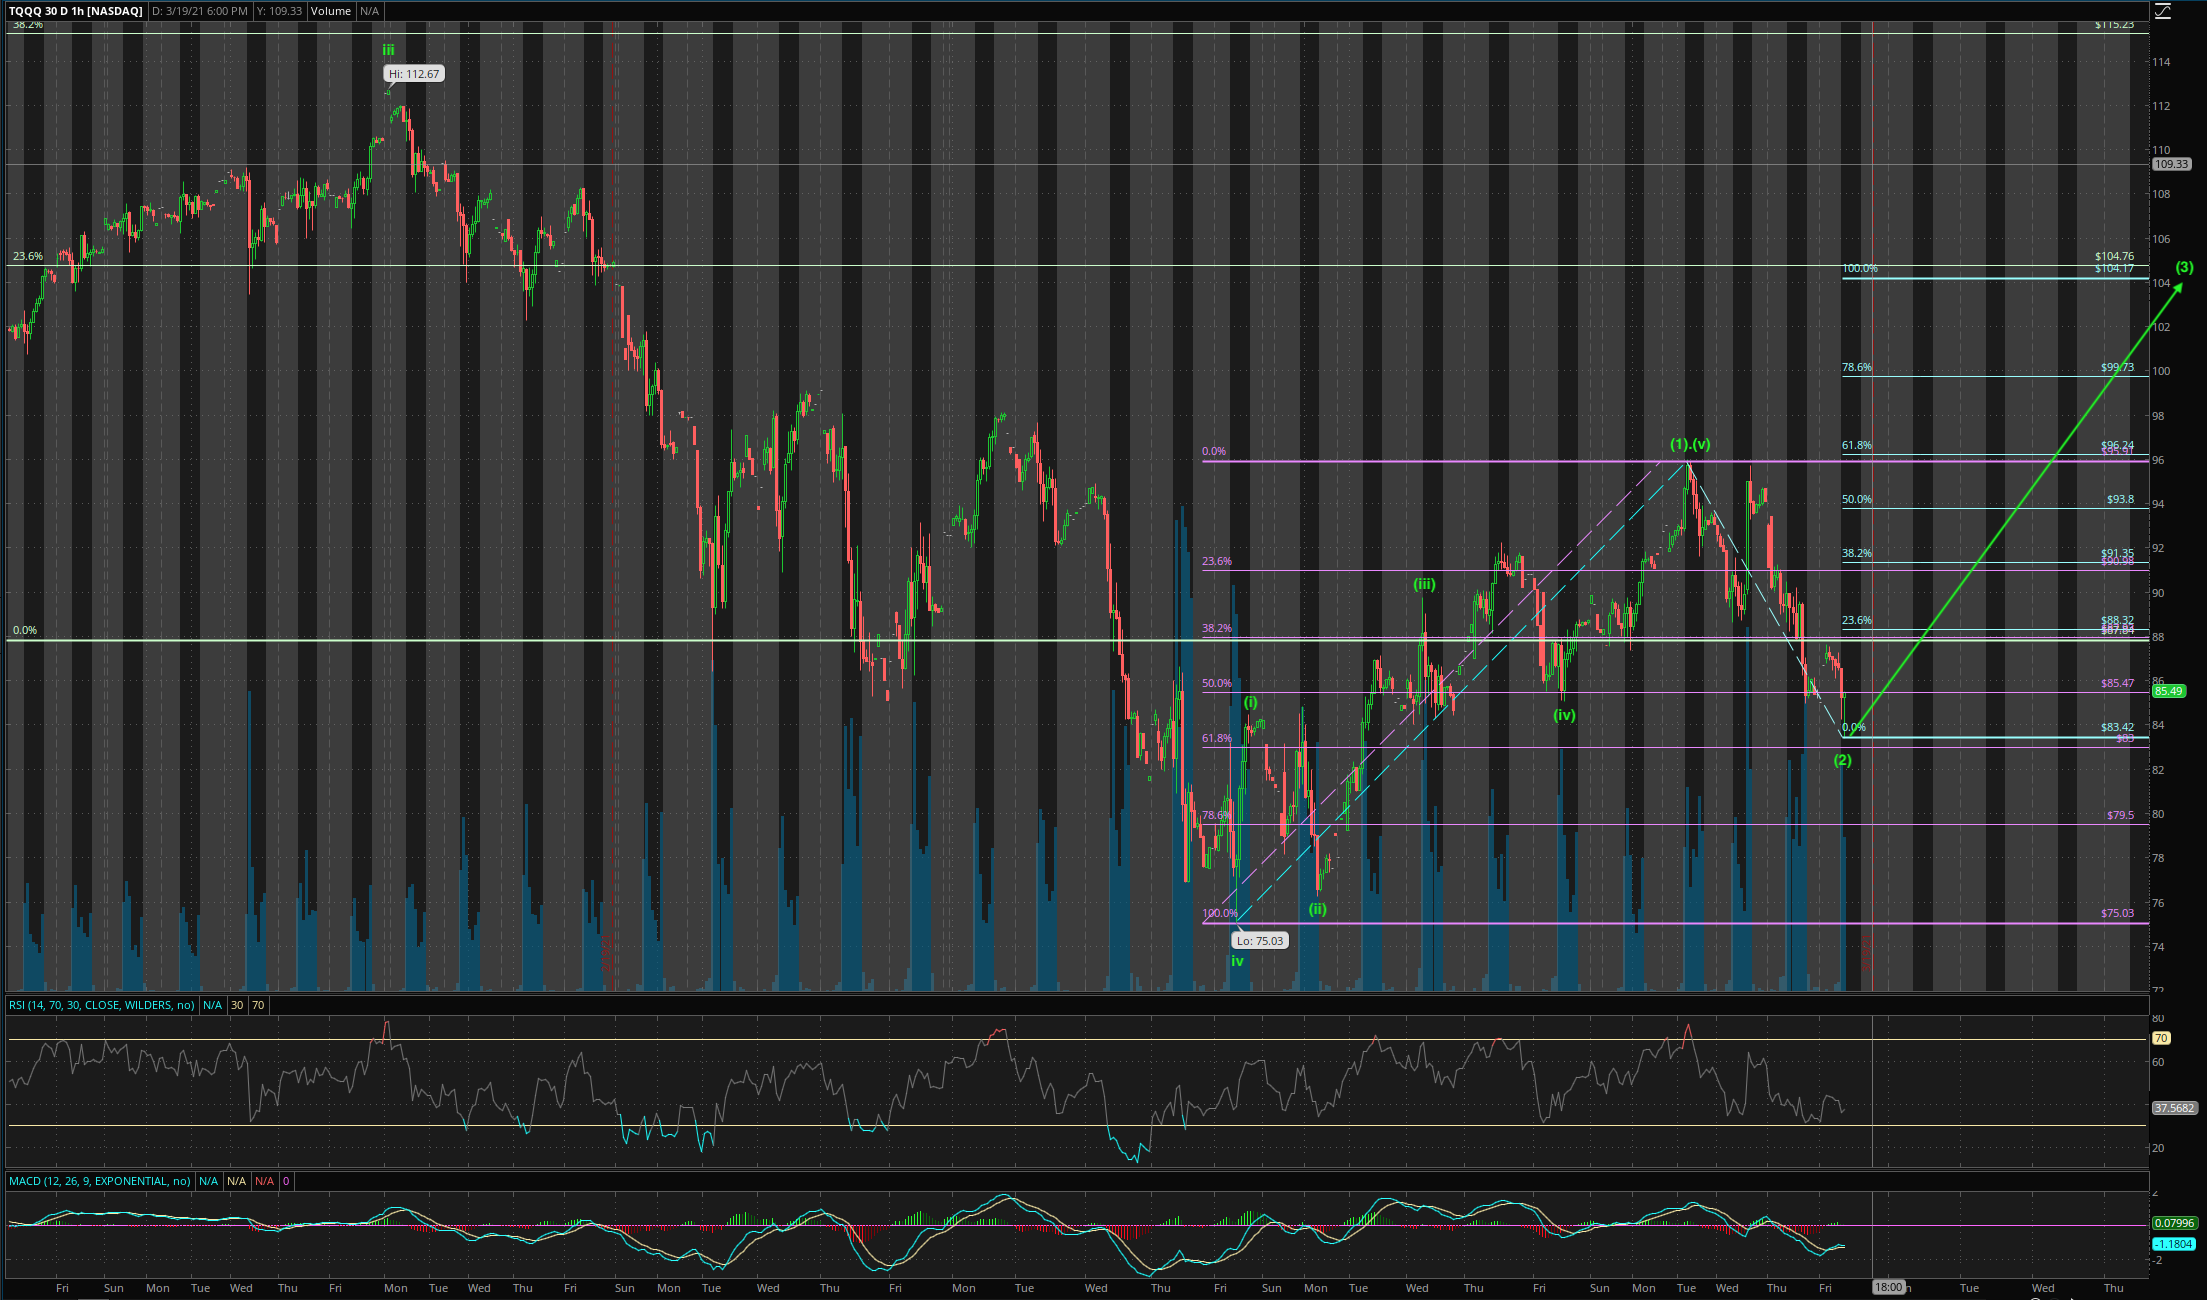
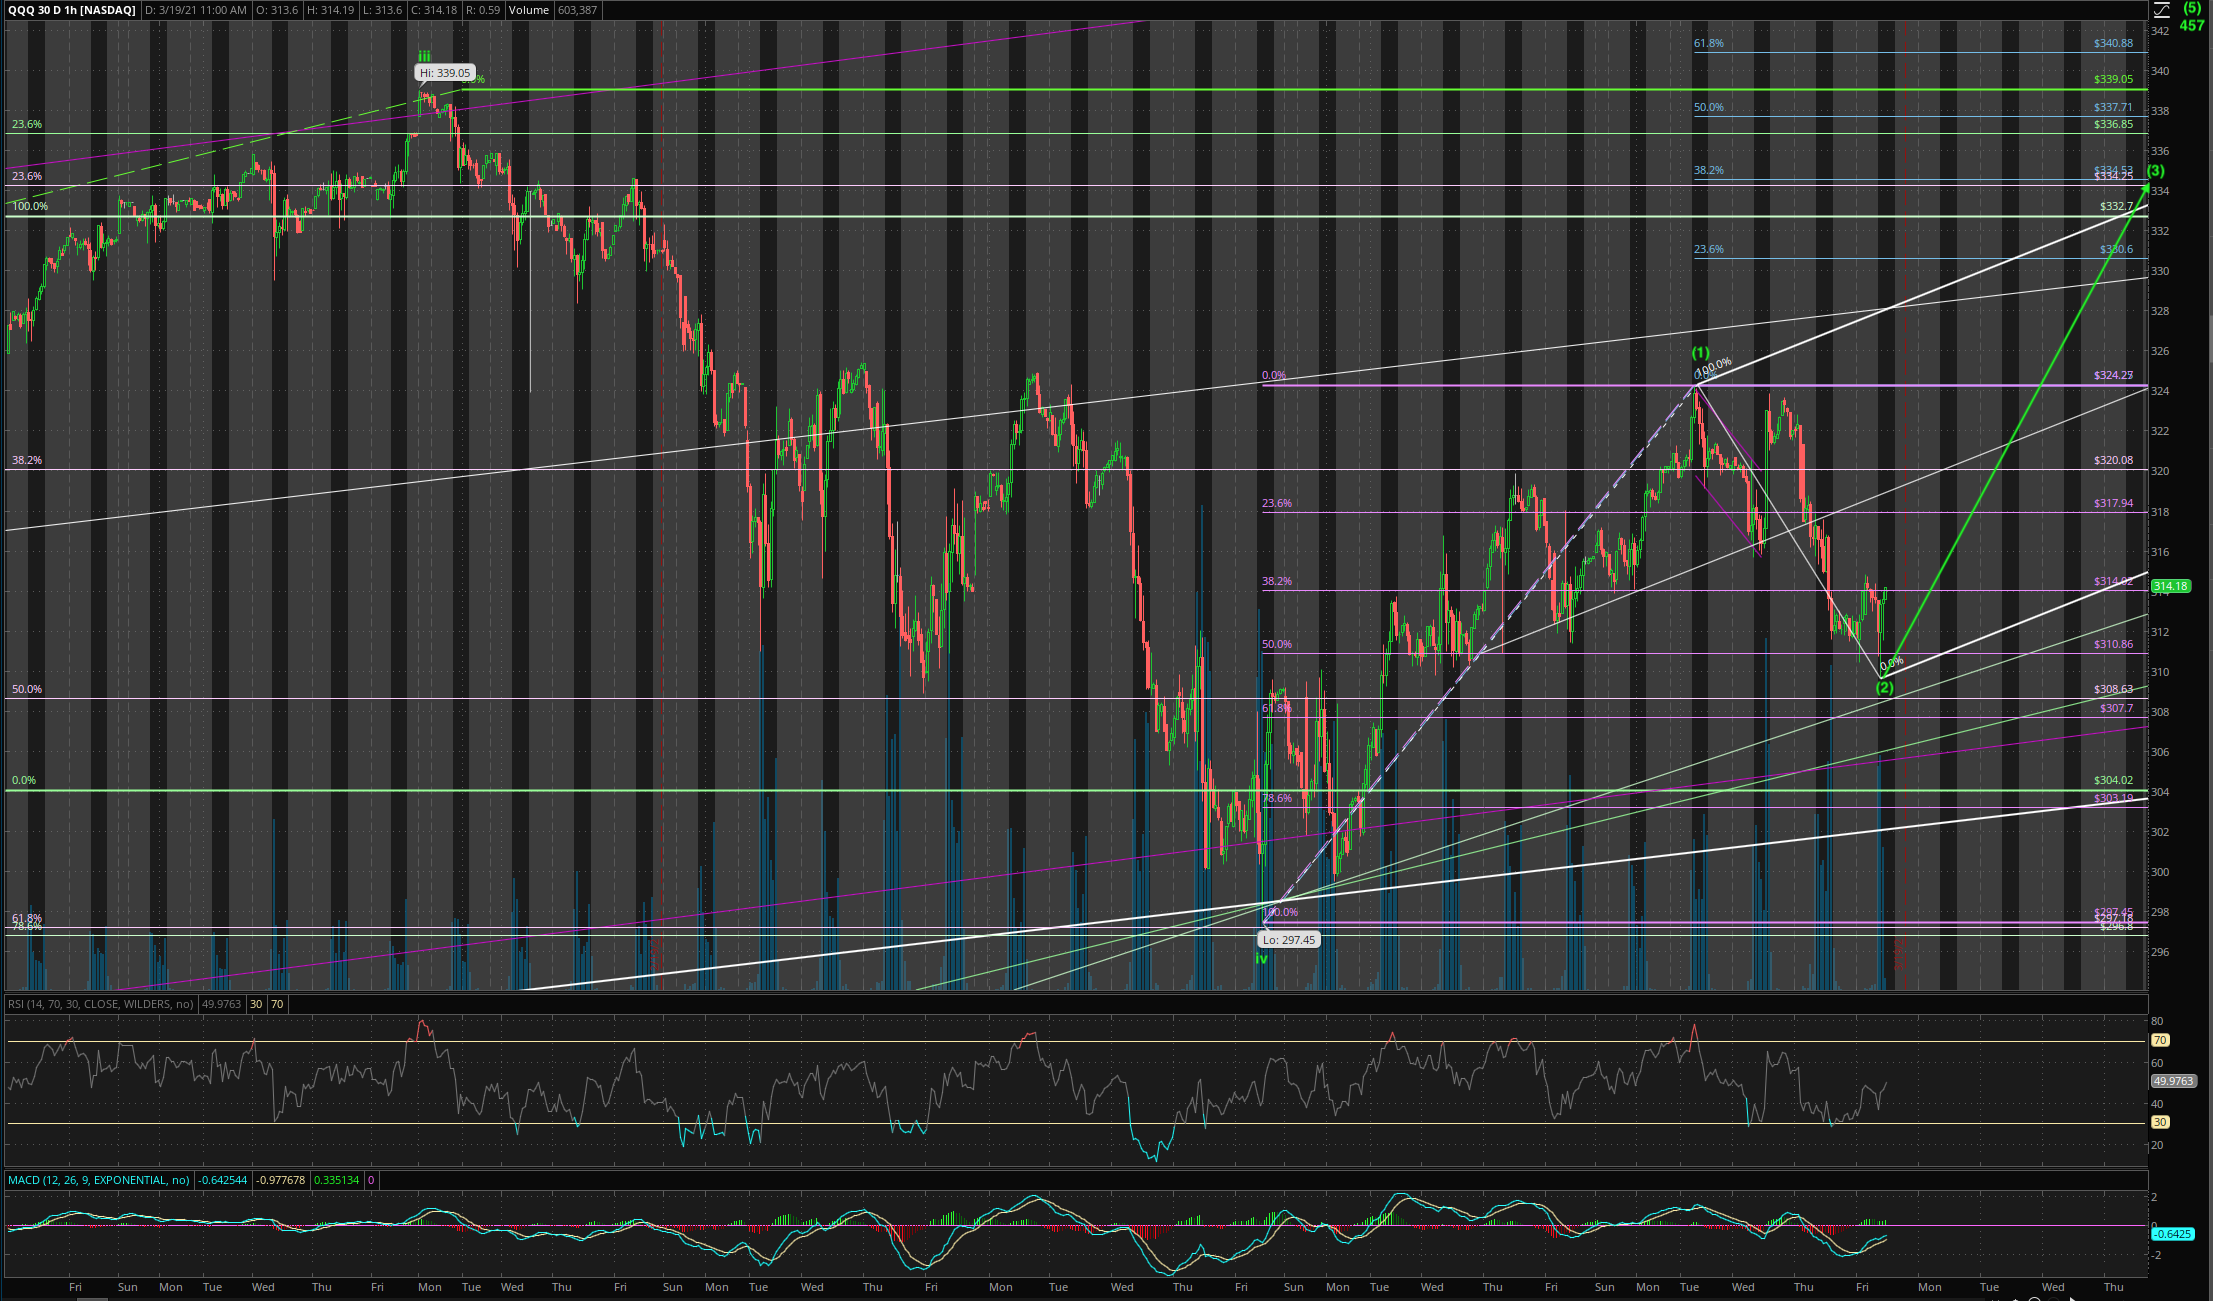
Spending too much time on SPX! Now then got time to see QQQ, dumb. Nothing much to fear, just a wave (2) down… which ofc may or may not be completed… if completed… target of wave (3) is $338. Didn’t add anything because afk the whole day. Wasted one good BTFD.
Peddling EWT to @manch
.
.
.
Btw, critical time now… if indices don’t make a new intraday high soon… ominous. Instead of (2) (interpret as zigzag abc), we get a bearish impulse (123 instead of abc)… holding my breath.
1 Like
EW is voodoo snake oil. 
Meanwhile Goldman Sachs put out the following prediction:

.
GS uses EW ![]() to forecast those targets. Verify yourself. Didn’t I tell you that QQQ seems to indicate bullishness till 2022. Anyhoo, didn’t my SPX targets are 4250-4455. I think you should text Master Wu aka black Panda why he is so bearish… we know Panda is a bear.
to forecast those targets. Verify yourself. Didn’t I tell you that QQQ seems to indicate bullishness till 2022. Anyhoo, didn’t my SPX targets are 4250-4455. I think you should text Master Wu aka black Panda why he is so bearish… we know Panda is a bear.
Well the Black Panda is still predicting doom and gloom. So is your YouTube boy.
Voodoo.
Do you know quite often GS publishes the opposite? So their clients can unload while the public who believe them are holding the bag. Black Panda doesn’t have that agenda, nor is Rob. Can’t remember Rob says market is doom and gloom, sound more like rotation. IMHO, it is pretty clear that market is in a distribution phase… just don’t know how long it would last. You can see from GS chart that SPX is grinding slowly upwards, no more fast appreciation. Market can suddenly turn into marked-down phase at the blink of an eye.
Agree with Panda that “when NOT to trade” is difficult to do. Was thinking of liquidating all trading (not buy n hold) positions… patiently waiting for the final last leg… which unfortunately can last few months to 2-3 years… Yes, Panda could be right, GS/ Marko could also be right,… both could be wrong too… looking at the chart, is possible that century top is in (recalled it is already above my minimum price to call it a peak?)… very indecisive… monitoring is all I can do now… meanwhile subconsciously persuading my innerself to liquidate trading position.

No. Impossible.
Now that I know Panda is a Trumpist he’s 100% wrong.