Anyhoo, Panda will eventually be correct. Prices don’t go up forever. At some point there will be corrections and even bear markets. He will be the first one to tell the world how correct his predictions are.
I am more worried about your “century top” call. Seems a bit too bold. Or maybe you meant prices will keep making new highs thus there will be a new century top every year?
Century top. Century refers to the length of impulse is 1+ century long. Top as in there will be a retracement of that impulse. Whether it takes 1 second, 1 month, 2 years, etc… I don’t know, Panda seems to know using his cycle analysis. All indications that this top should occur in 2021. How low can it declines to after top? Panda has answers, I don’t have but should be at least 23.6% retracement, around 3300 minimum. However, I would be disappointed if it didn’t decline below 2200.
Neither Panda and me are interested in these type of run-of-the-mill corrections and bear markets. We are interested in the century top [I] and the ensuing century wave [II].
It hurts me much more if I don’t prepare. If market keeps going up, my buy n bold AAPL and S&P index fund would laugh all the way to the bank. My nominal NW has been making regular ATHs. If it goes into century wave [II] and I am not ready, my buy n hold would be decimated for many years or decades. If I am prepared, I can make tons, notice I have $$$ waiting.
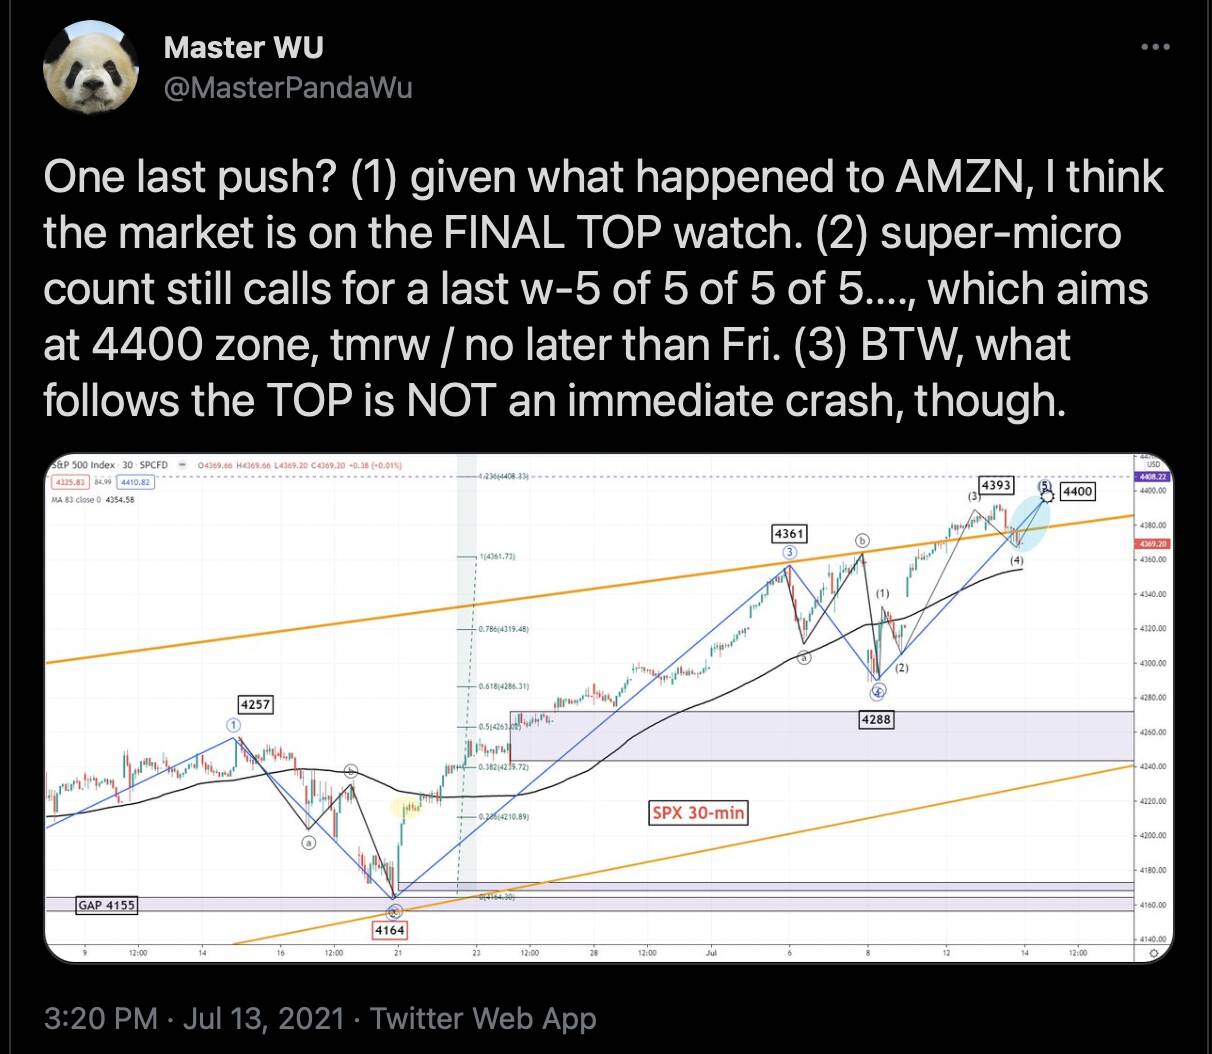
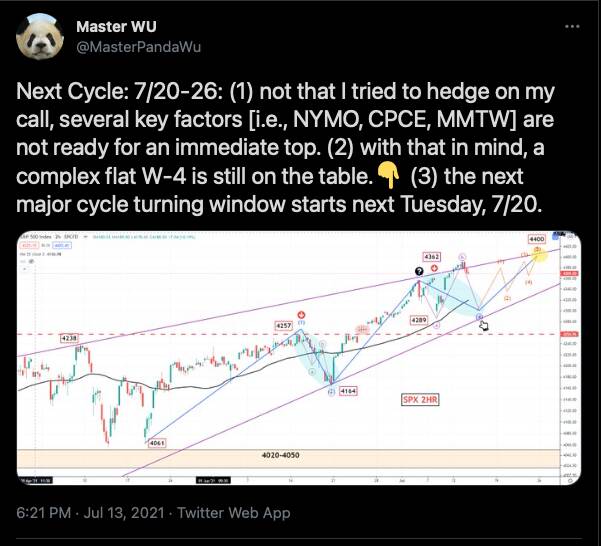
From Panda’s tweets, he always put wave three (W-3) as the crash wave. The first decline is always wave one (W-1). This is inlined with EWT that wave three is usually the most powerful wave.
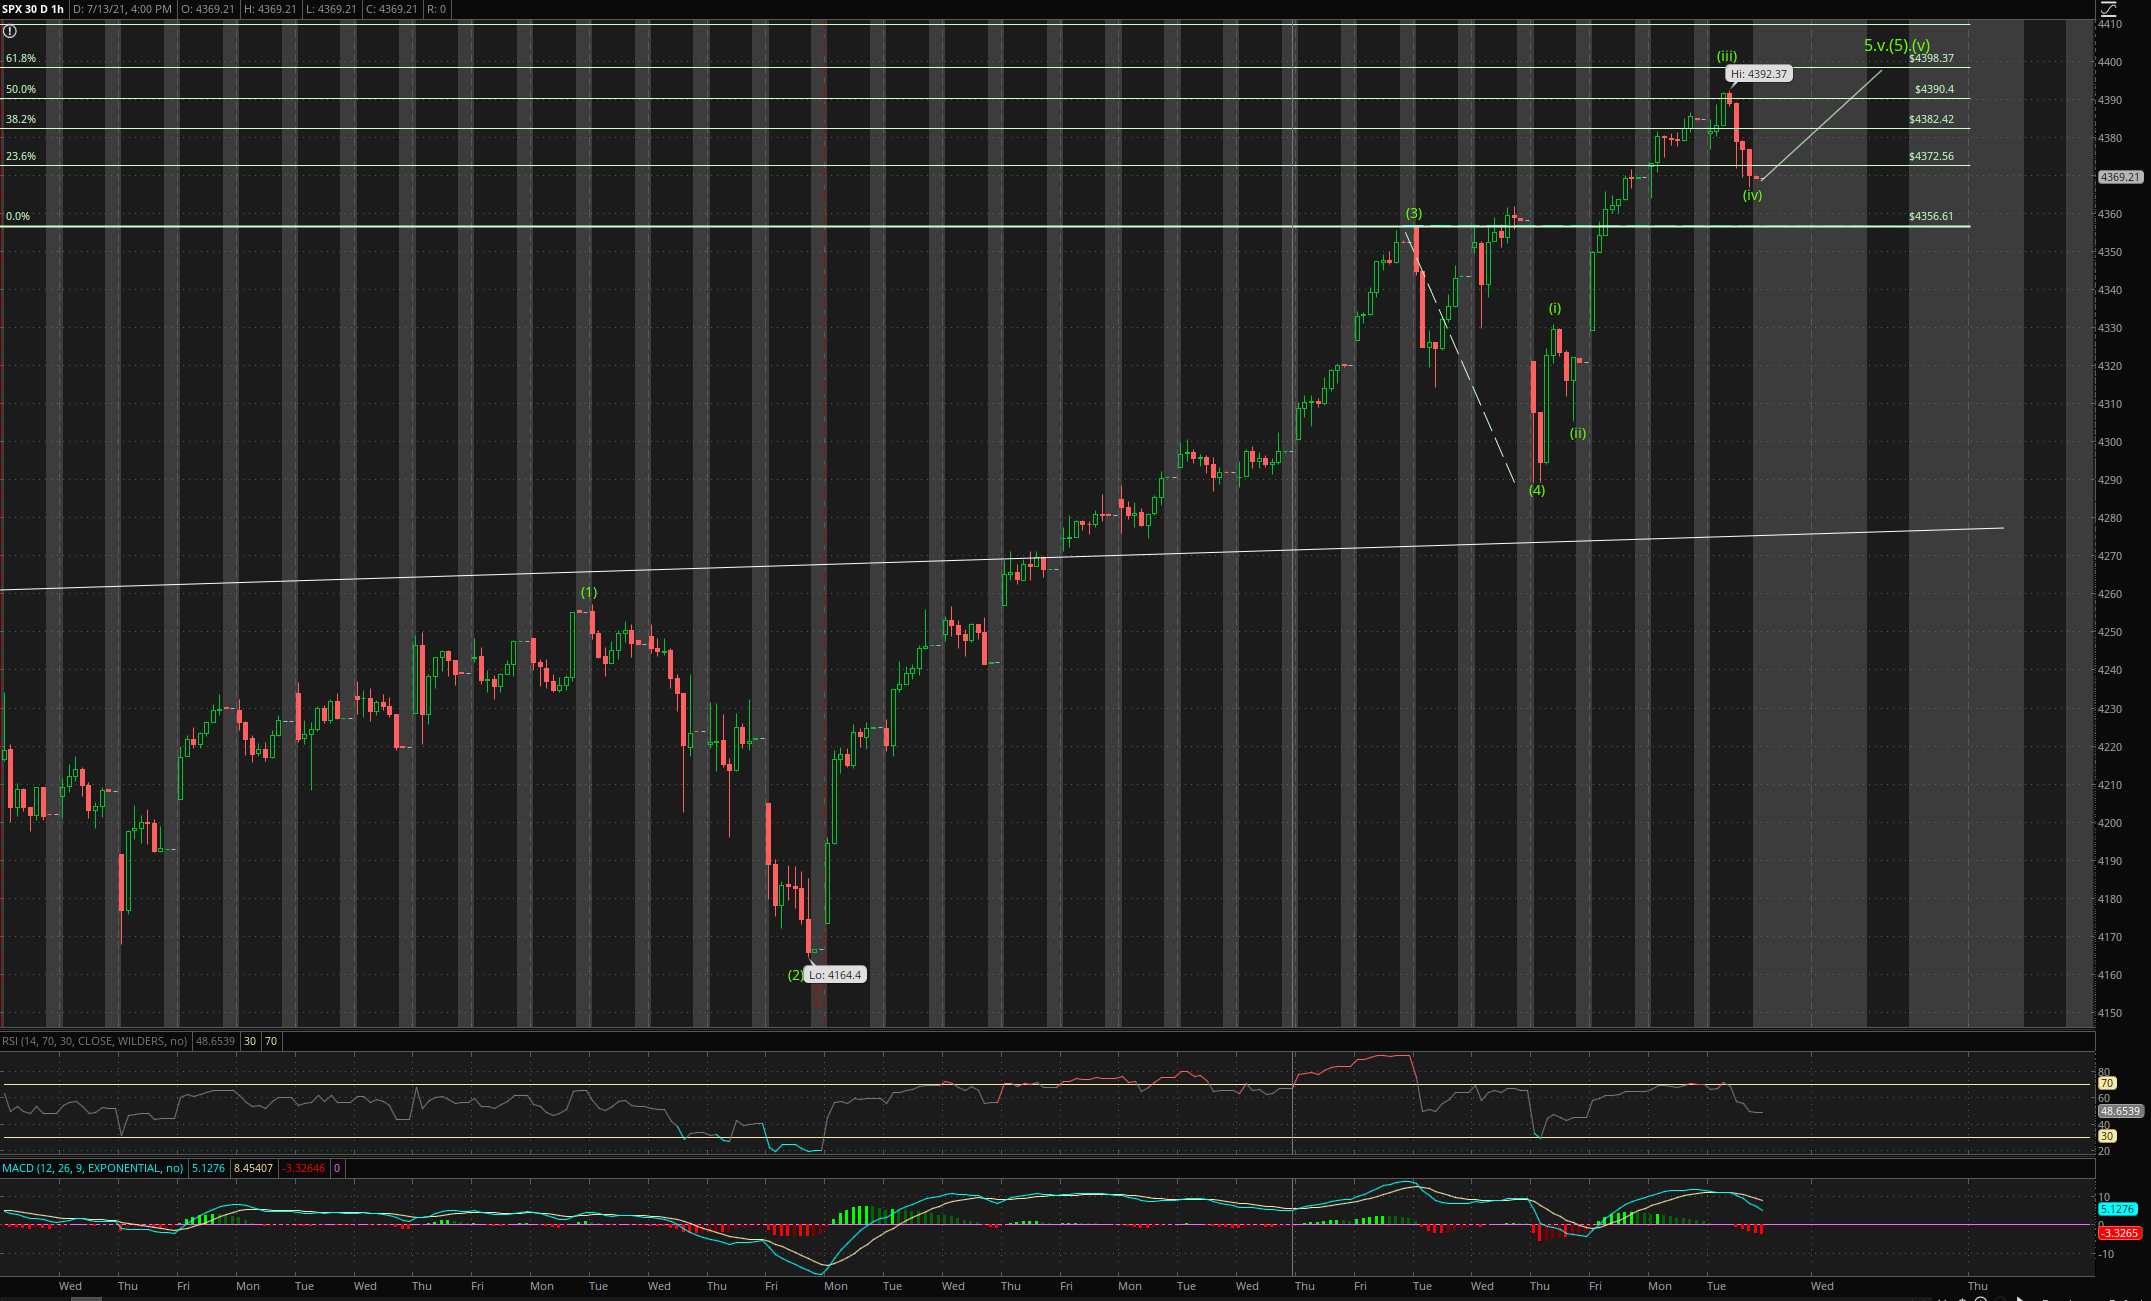
As usual, Panda forced the EW picture to be inlined with his cycle analysis. I prefer the original count i.e. complete century top ~4400 by Friday.
SPX: After hitting 4393.68, it has declined sharply… is it wave (iv) or start of bear market or ? Let price action tell us. If need explanation of what kind of price action, don’t bother to ask, you don’t have what it takes to understand enough previous explanation and illustration already.
There is a deep psychological need to guess/predict how the future will unfold. That’s why religion is so alluring.
If his prediction turns out correct, it will be no doubt due to his ingenious foresight. If not? Must be some nefarious “price actions”. There’s always next time.
Instead of predicting the future, let’s learn from the past. Here’s a quora post from December 2020. Not using this to predict the future, just sizing up the probabilities of different outcomes.
Historically, the S&P500 has delivered a 20% or better total return (dividends plus capital gains, but not adjusted for inflation) 30% of the time. However the chances vary based on economic fundamentals.
One important one is inflation. The chart below shows the frequency the S&P500 total return beat 20% versus the inflation over the previous 12 months. You can see that when inflation was over 4%, the S&P500 total return was 20% or better a quarter of the time. Even though inflation gives the S&P500 an artificial boost, stocks do worse than average after times of high inflation, partly because the Fed hikes interest rates, and partly because high inflation is bad for the economy.
In severe deflationary times, the performance was even worse. Significant deflation is very bad for the economy. The best chances over 40%, seem to happen with mild deflation (less than -2%) or mild inflation (2% to 2.5%). This is the range of inflation central banks target, on the theory it is optimal for the economy. The red dot shows the last 12 months inflation rate, which suggests we might have a bit better than the overall average frequency of 30%. But if the Fed had been more successful in 2020 in stimulating the economy, getting inflation up a bit more, the prospects would have been better for 2021. If the Fed had done less, and inflation was zero or slightly negative, history also argues for a higher chance of a 20% or better gain.
Dividend yield also matters. The chart below shows the frequency of 20%+ total returns versus previous 12 months dividend yield. Again, the red dot shows the current value. Very low dividend yields, under 2% are seldom associated with great returns the next year. Generally these result from dividend cuts that are not reflected in stock price declines. When you’re paying more for your stocks, and getting less in dividends. that’s not a great scenario for optimism.
Dividends in the range of 2% to 3% are normal, and stocks do well the year after paying at that rate, breaking 20% total return 35% of the time. Higher dividend yields usually come from price declines while dividends are fixed. Initially, as prices drop to make the yield just over 3%, this is a bad time to invest, prices are still dropping. But as prices drop more and more, and dividend yields go up, prospects for the following year improve dramatically.
Finally valuation is important. The next chart shows frequency of 20%+ total returns versus cyclically adjusted price earnings ratio at time of purchase. The best time to buy stocks is when they’re cheap, buying at P/E under 10 means a 50% chance of getting more than 20% the next year. But once P/E ratios get above 18, your chances drop to about 20%.
Looking at all these charts, I think a 20% chance of a better than 20% total nominal S&P500 return in 2021 seems about right.
Those red dots are from last December. You can use the charts to see where we stand right now.
For example, most religions have something to say about people’s after lives. Unknown futures are scary. People need some assurance of what’s ahead of them.
Humans just can’t accept things happen out of randomness. They always need some reasons to explain what had happened, and then try to use those reasons to predict the future. Religions grew out of this human need.
Can’t name any religions so whatever deductions associated with religion is invalid.
Some people believe in afterlife is a psychological wish for immortality. Humans are keenly aware that they won’t live forever, one day they would die, yet many wish they can live forever. Believing in afterlife means there is a continuation of life “on Earth”, thus immortality.
EWT Probabilities of different (preferred, alternatives) counts from learning about the past.
The probability of the preferred count by Panda is not 100%, I got a feeling some dense people don’t seem to know that
Humans created "randomness " to describe events sooo complex that they were not able to understand them absolutely. But universe is absolute otherwise it could not exist. There is no randomness at all. Not even in quantum mechanics.
Some people are so dense that simple events are random
Flipping a coin is considered random (no fancy cheating ofc). Outcome of the flip is independent of previous flips but we know for sure is either a head or a tail.
Randomness may not be as systematic and unpredictable as you might assume…
Humans are also hard-wired to see patterns where none exist and where outcomes are truly random. That is the basis of superstition. It exists in other animals as well, it’s even been documented in Great White sharks. The evolutionary basis for it is that if you’re always looking for patterns but get it wrong 19 times out of 20 and the assumed pattern was just random the payoff that 20th time can exceed the wasted energy and loss from the other 19.
You’re touching on an idea used in trading which is distinct from forecasting. By forecasting, I don’t mean pinpoint single digit and also don’t mean 100% accuracy. Forecasting has always been about probability of possible outcomes. Frankly, I don’t know what you meant by patterns.
Agree with first phrase without “where none exist” even though I don’t think we have same understanding on what are patterns. 2nd phrase (after and) requires elaboration because what is meant by random outcomes? Flipping a coin (no fancy interpretation), sure to be a head or a tail, can’t have a random outcome like a hand Anyhoo, I view your statement as a broad generic statement and don’t intend to apply to stock price behavior, otherwise you would need to prove the applicability
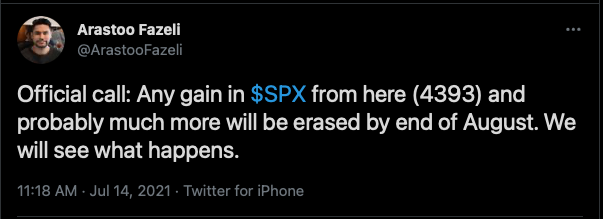
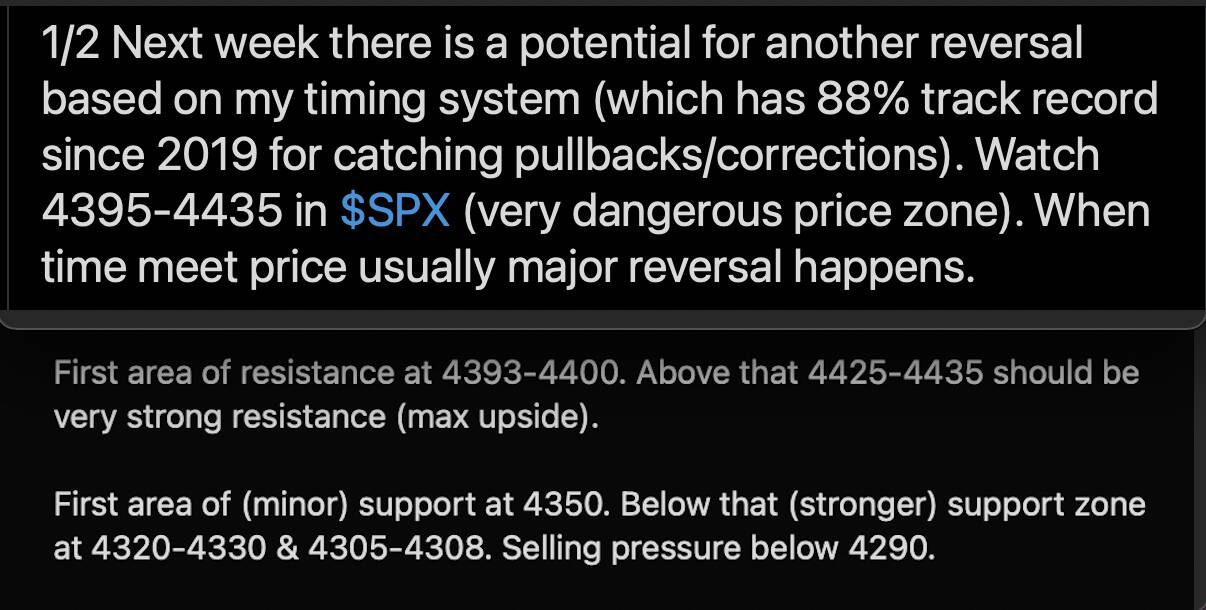
Below is S/R levels predictions by Arastoo… An aggressive trader would long SPX now, stop loss set at 4289. More conservative trader would wait for 4305 to long… might or might not touch there… Arastoo didn’t issue probabilities for each S/R levels (possible outcomes, not random outcomes).
They would close trade using Arastoo R levels or RSI or pivots or EW fib levels, etc or just around market close.

 enough previous explanation and illustration already.