Active trading is so hard! I buy 3x and to counter using calls/puts.
Still have stocks. I sold covered calls( DEC 11th) for all holdings so that market dips I am protected, es MRNA and BNTX.
Active trading is so hard! I buy 3x and to counter using calls/puts.
Still have stocks. I sold covered calls( DEC 11th) for all holdings so that market dips I am protected, es MRNA and BNTX.
IMO, his FGI is right. Again some appx index, which guide us.
Market normally spikes high before a steep drop. You must account fear greed index.
I have my own FGI which will tell me when to sell stocks. Today is the day for me - sold all stock except two for which I have covered call ( insurance against possible drop )
If there is further bull run, I never bother about it.
I am a non-believer of close all position. Just reduce exposure. Also not an ambidextrous trader (no instinct to short).
Semi trading portfolio: 6% of size
Main trading portfolio: 15% of size
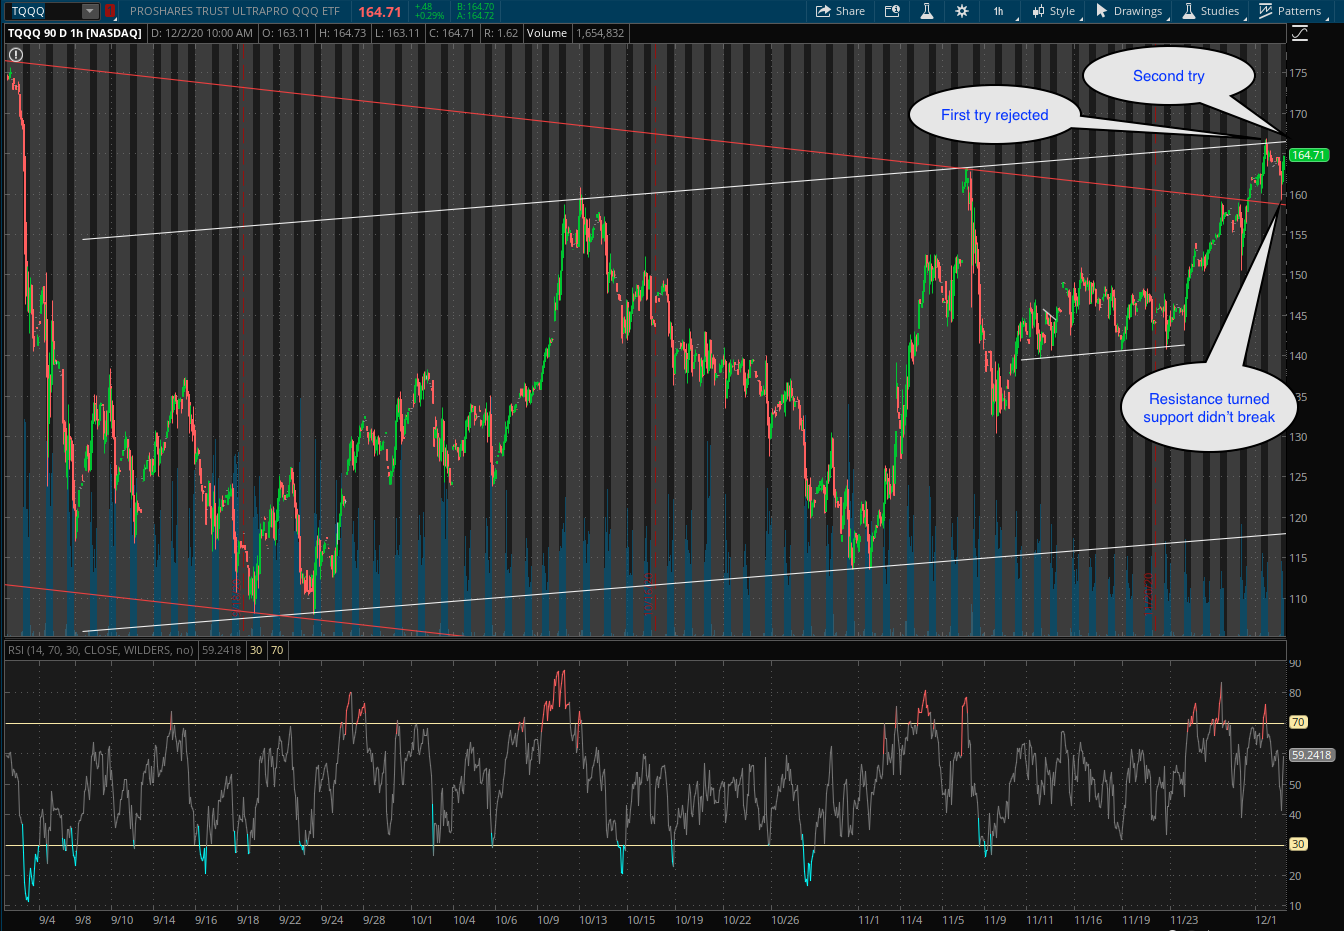
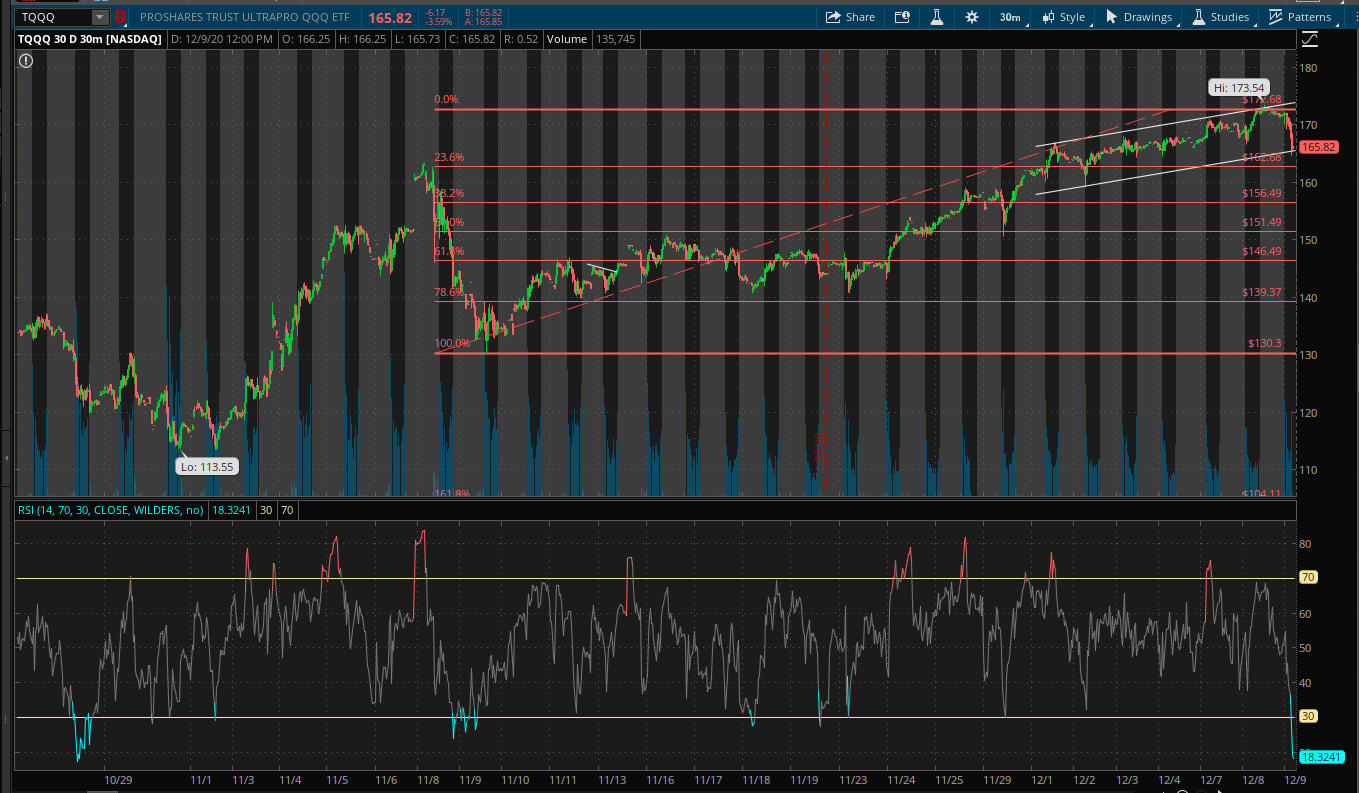
TQQQ doesn’t look that bearish. Here come the breakout! Holding my breath ![]()
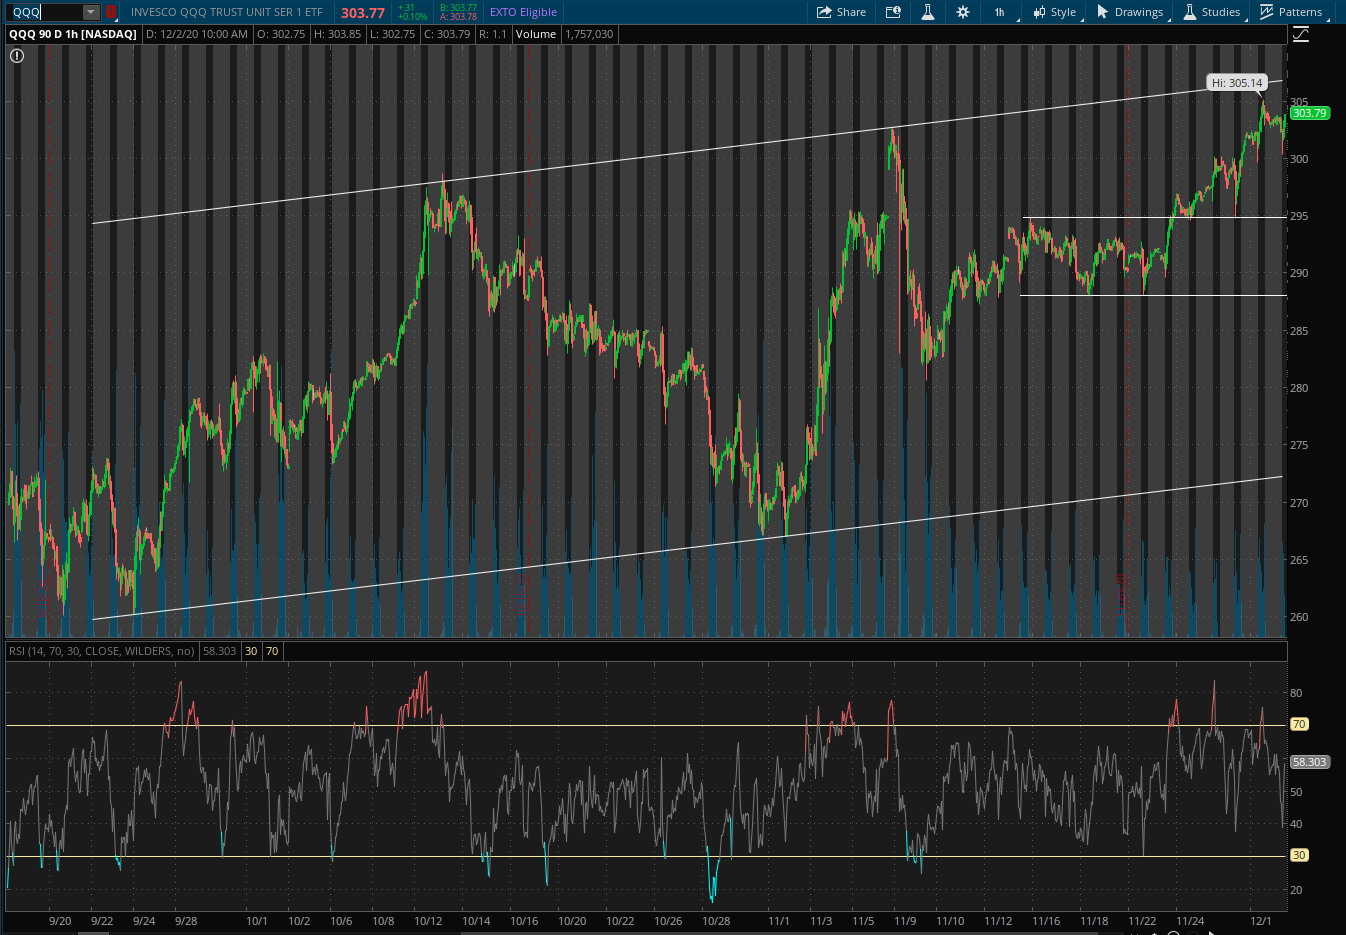
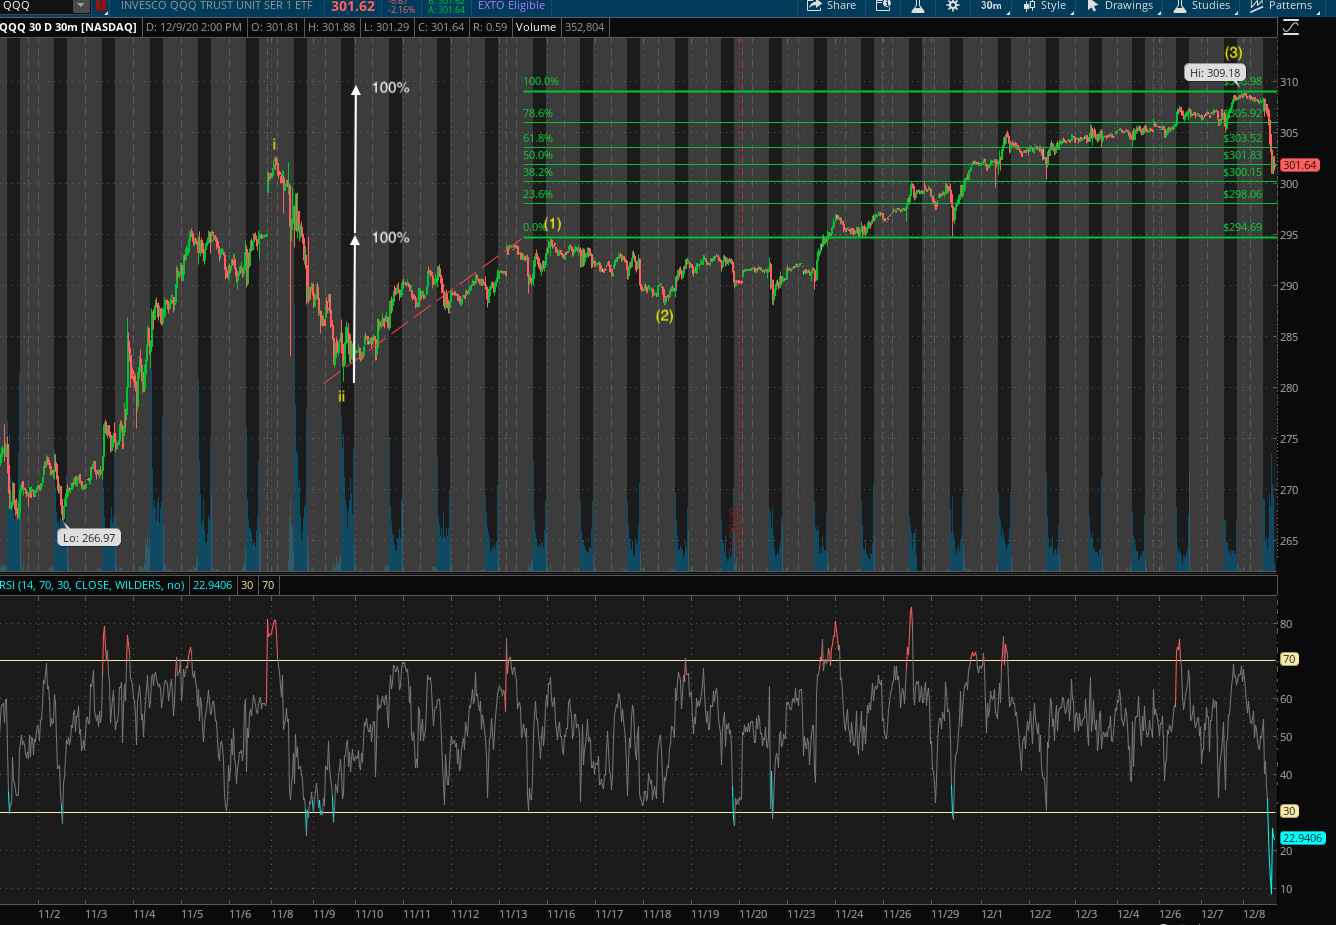
QQQ shows slightly different picture. Yet to challenge upper downtrend line?
I am also holding my SQQQs, do not want to disturb until end of day. I would have cashed some nicely morning. Any way, I do not like to trade it without good returns.
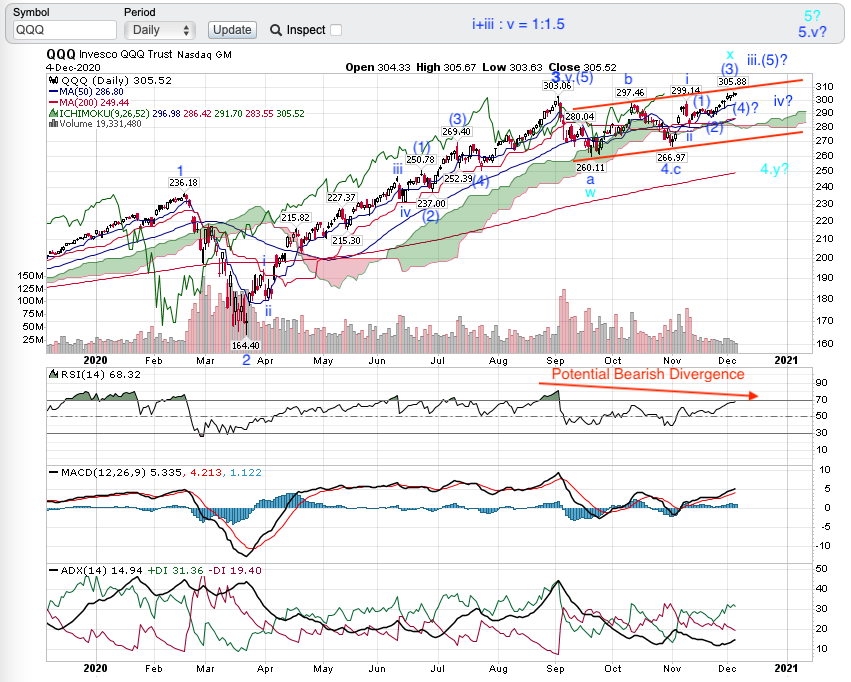
EW counts below including after-the-fact waves for those who don’t understand EWT. Obvious for Elliotticians. In general for the purpose of trading is good to have a preferred count and an alternative count ![]() Good for? Risk management ofc !
Good for? Risk management ofc !
Preferred count in blue
Alternative count in light blue
For the astute, you would deduce from the counts that the impending corrective wave dropping below $295 would mean the preferred count is invalid and alternative count is likely correct. Another deduction is magnitude of decline for Minor degree wave (4) is less than that of a higher degree Intermediate wave iv which ofc is less than the even higher degree wave 4 - only EWT can do that ![]() Ditto for price appreciation. One more deduction is if the anticipated decline wave (4) didn’t drop below $295 and re-bounce to higher than wave (3) i.e. higher than $306, can continue to trade using preferred count. Another deduction… ok… if you are astute enough should be able to make more deductions.
Ditto for price appreciation. One more deduction is if the anticipated decline wave (4) didn’t drop below $295 and re-bounce to higher than wave (3) i.e. higher than $306, can continue to trade using preferred count. Another deduction… ok… if you are astute enough should be able to make more deductions.
Many alternative counts, why mention this particular one?
Because there is a potential bearish divergence between 3 and (3)/ iii.(5) with RSI which put the probability that (3)/ iii.(5) is in fact a wave x leading to price decline to wave 4.y.
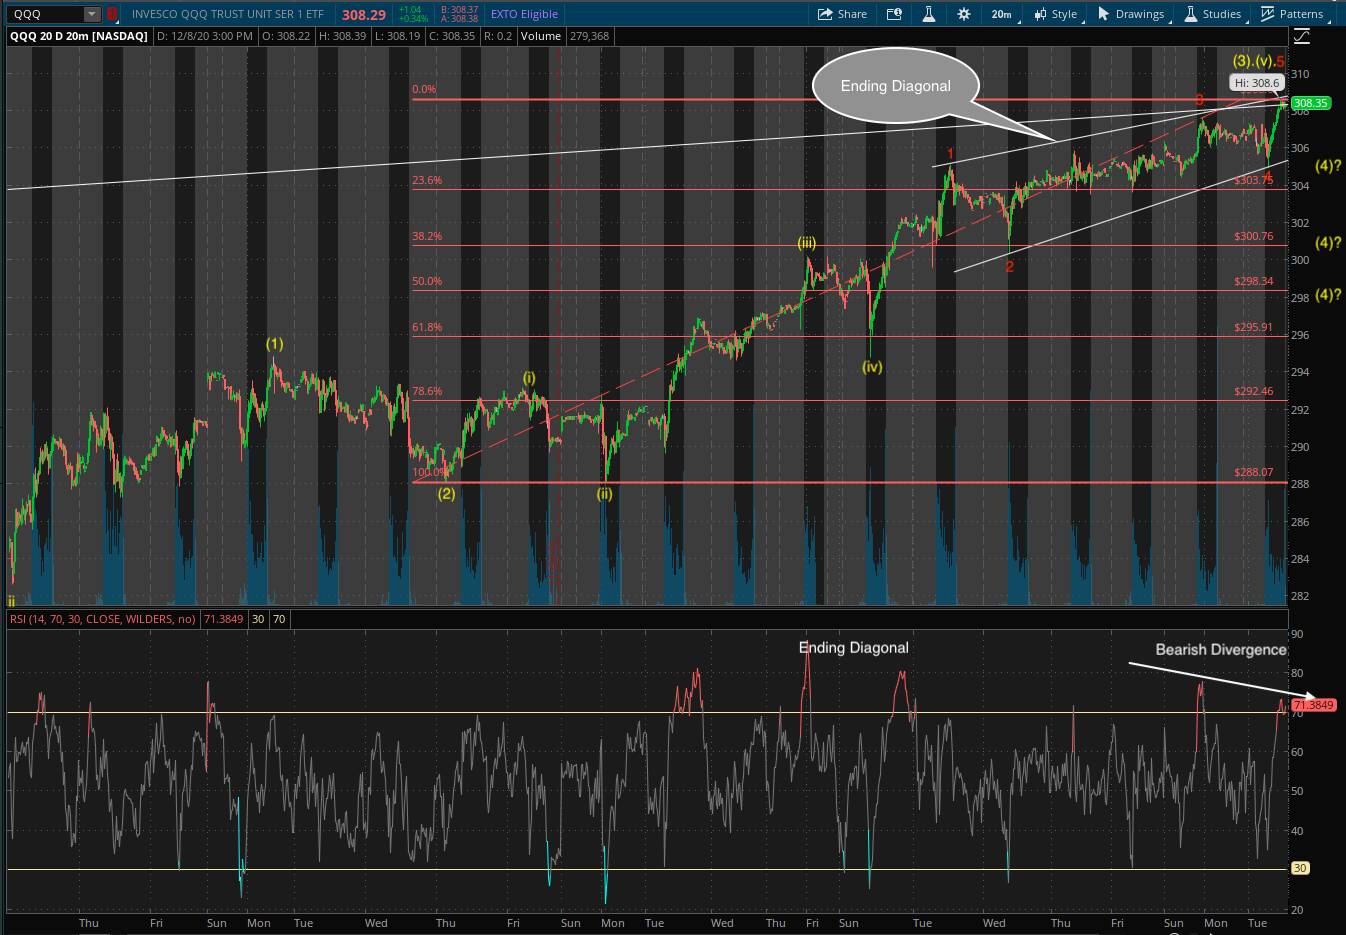
@Jil algo may be one-two days too early. QQQ indicates bearish divergence. Expect QQQ won’t go above $309 2mrw and will decline to around $300 before recovering.
Walk the talk: Long 3 QQQ puts. Just multi-day trading because QQQ would recover pretty quickly.
With current closing at $308.29, if QQQ reaches $309, it is just 0.24% increase, which easy to touch.
Tomorrow, QQQ may easily cross $309 ( guess work as I do not know the future percentage increase).
The only reason is tomorrow is another bullish day.
IMO, market won’t fall until congress decides about stimulus and funding to avoid shut down.
Also, volatility is too low, puts does not provide good returns. Even knowing ahead I was able to make very low $300 only a day. I find buying one month puts returns are not so great with low volatility.
? Is why buy puts or calls.
True, not preferable to buy spy or qqq side, looking for some high IV stocks to play.
Don’t get addicted ![]() Last week, I collected $10k doing nothing except short puts few weeks ago.
Last week, I collected $10k doing nothing except short puts few weeks ago.
Just to remind you, don’t short put in a bear market.
AH hit $309.18, expect QQQ to start its decline journey to ~$300 and my 3 QQQ puts will be happy.
Noticed pre-market QQQ going down, surprise to me !
Surprise? Told you SO!
Also told you time to short TSLA.
Power to EWT ![]()
For the first time, my algo failed to identify the fall.
Did your algo indicate bottom? My EWT Crystal is a little murky now. Spend all energy talking to you, no energy to analyze stock. Beside, hungry, need to eat.
TQQQ hits the lower up trend line and very oversold in the 30-mins chart. Please don’t forget I told you there is a bearish divergence in the daily chart which make an alternative count almost as valid as my preferred count.
Perfect EWT !
I missed this slide, I should have been really cautious in steps. Market is doing profit taking, it will come back by 1 pm, but expecting normal year -end correction will be there, but yet to establish clear line.
Whatever I missed is a mistake. My portfolio is saved with MRNA and BNTX even after coming down. Short puts are really helping when market bottoms.
![]()
QQQ lowofday so far is $300.96. Might have bottomed… monitoring…
A well executed short put benefits from theta decay and IV crush! Can withstand negative delta for a long while ![]()
Closed long QQQ puts and nibbling MU. Not yet buying any QQQ calls or short TQQQs or add TQQQs.