“There’s no such thing as a free lunch” is a trite cliché, but it’s useful when thinking about differences in housing costs in different parts of the U.S., especially for anyone considering permanent remote work as a way to save money. Places that look relatively cheap at first glance aren’t necessarily more affordable for most people who might want to live there—and some places that seem expensive aren’t as pricey as they look after careful analysis.
Consider the latest data on relative housing costs by metro area, published Tuesday by the Bureau of Economic Analysis. This isn’t a measure of house prices, which are affected by everything from interest rates to speculative fervor, but a measure of actual housing costs paid by renters as well as an estimate of how much homeowners would pay if they had to rent their current residence. The ranges are vast: at the top is the San Francisco Bay Area, where housing costs are more than twice the U.S. average. On the opposite extreme are the smaller cities of Appalachia, the Deep South, and the Texas-Mexico border, where housing costs are about half the U.S. average.
There are good reasons for these disparities. For starters, the average wage of an employed worker in the SF Bay was about $115,000 last year. That’s almost twice the average wage of employed workers nationally. By contrast, the lowest-income metros offer jobs with average yearly wages under $40,000. In McAllen, Texas, for example—the lowest-cost metro with at least 500,000 people—the cost of housing is barely a quarter of what it is in the SF Bay. Relative to local incomes, however, the difference in housing costs almost vanishes because the difference in wages is so large.
Try harder, academia. Stop using median or average or similar concept.
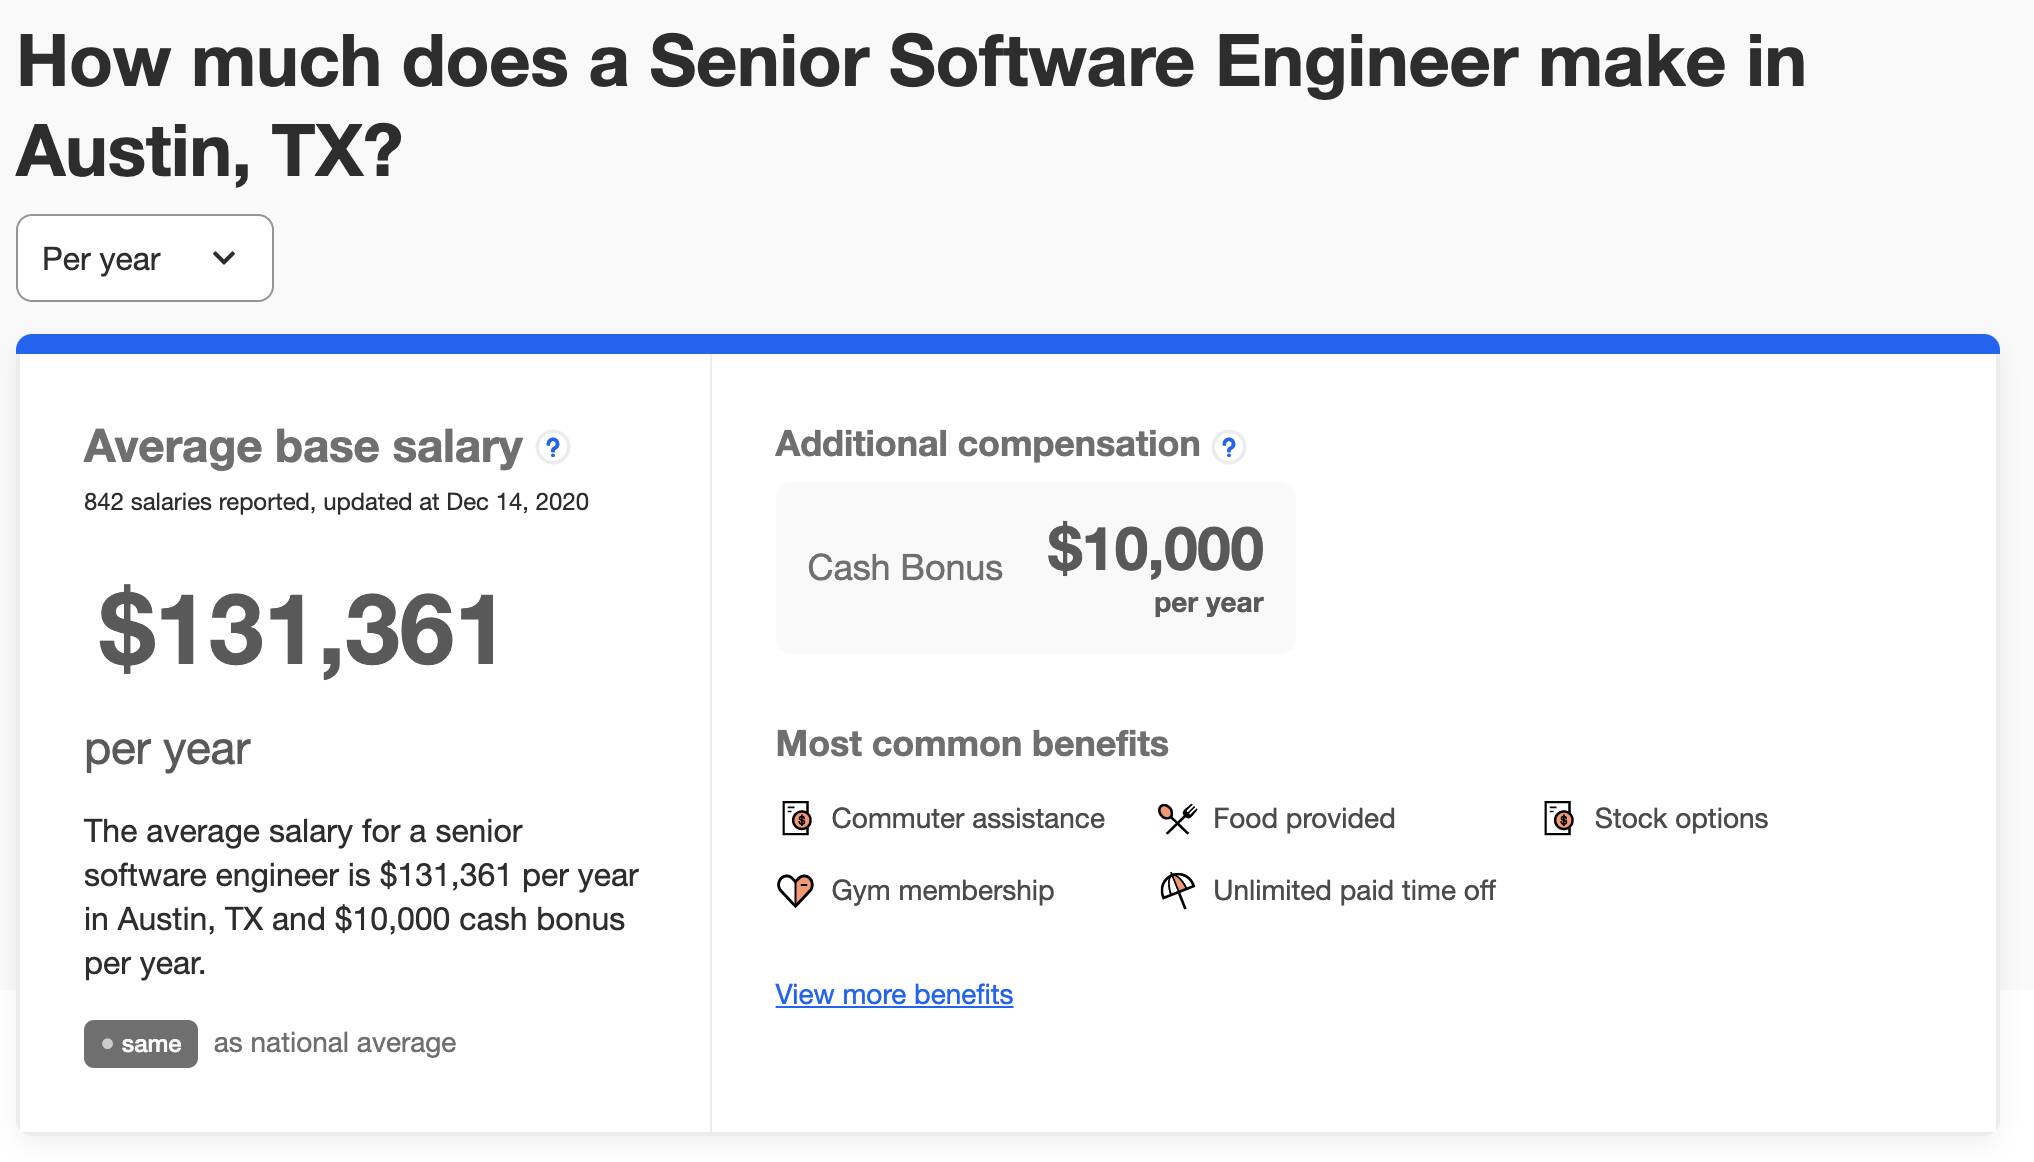
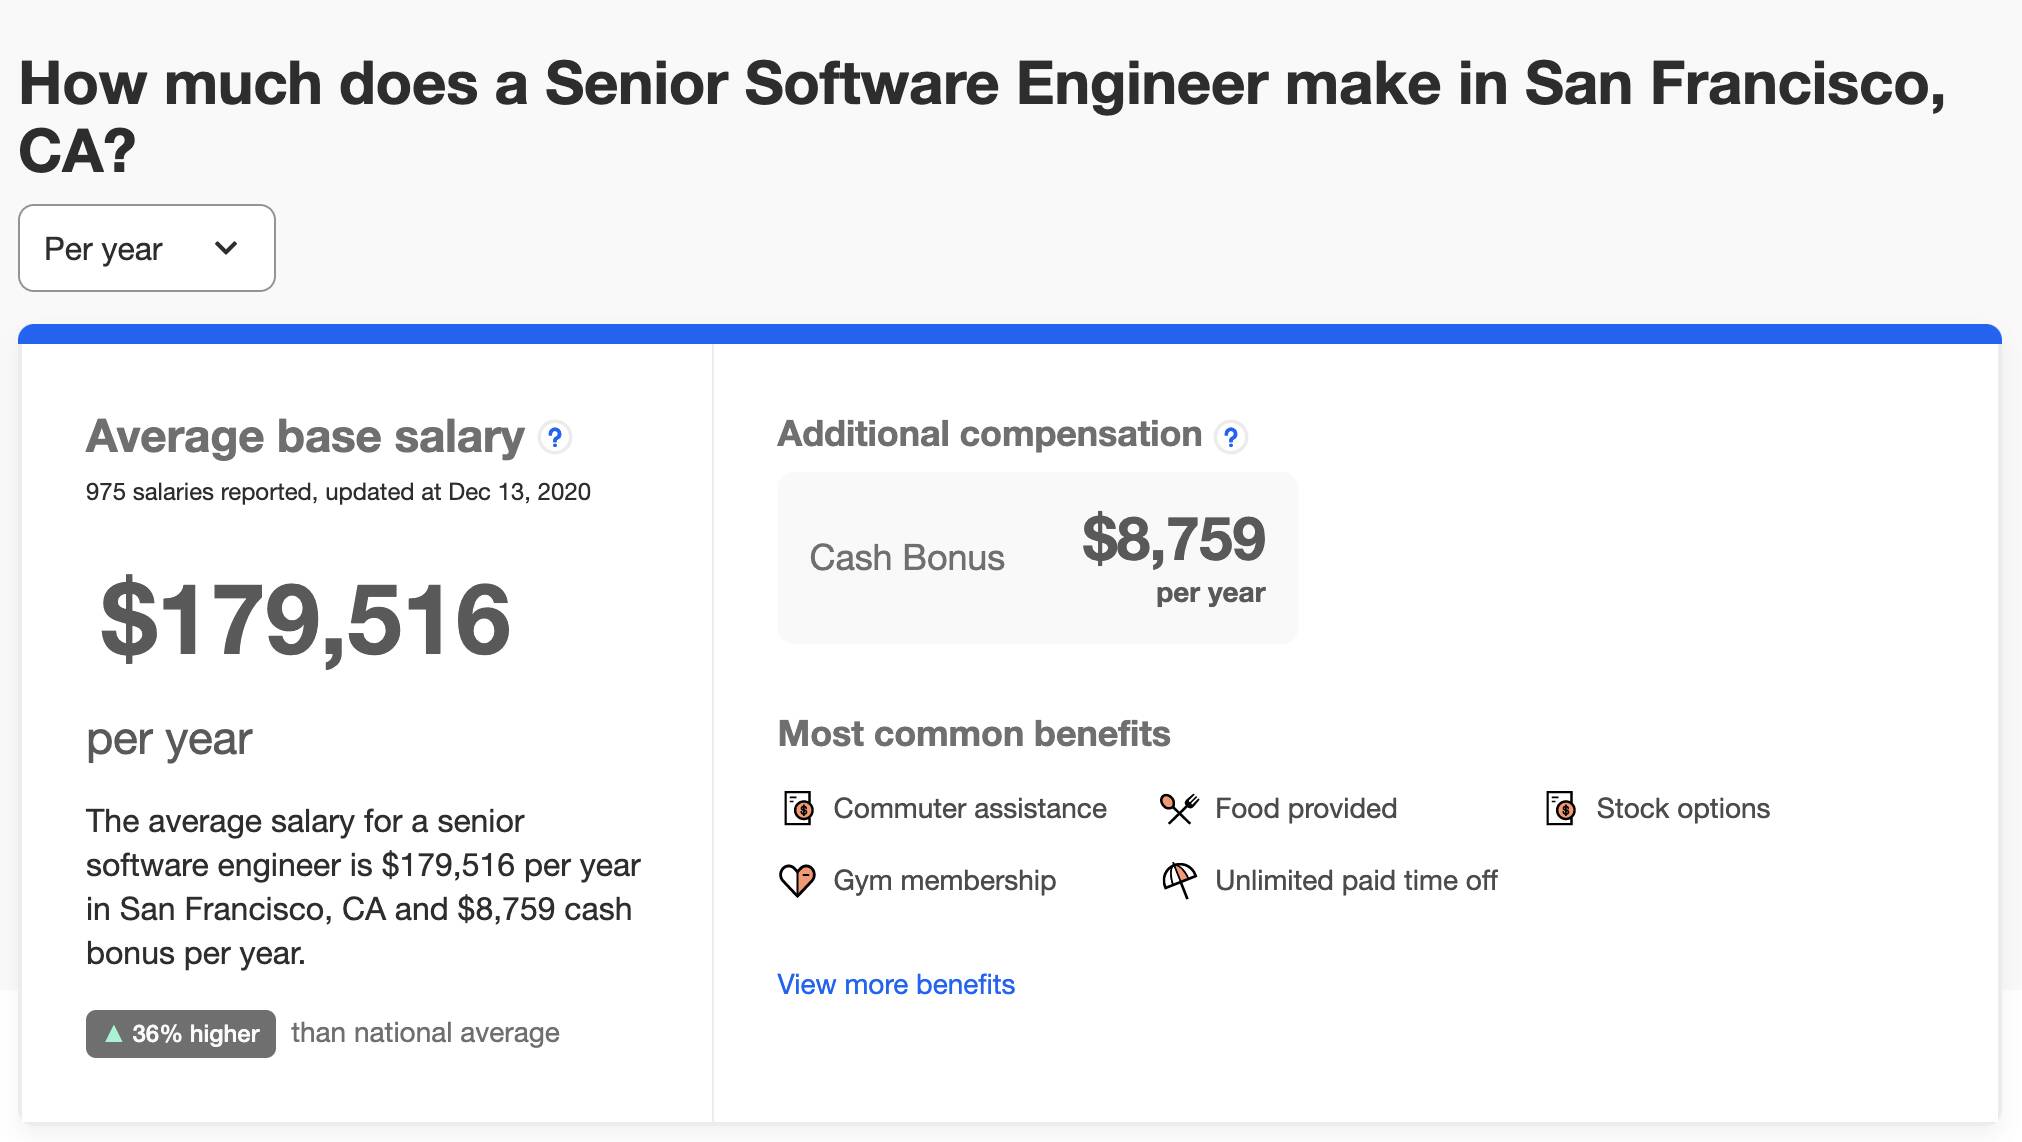
Pay of tech is 10% less than SV.
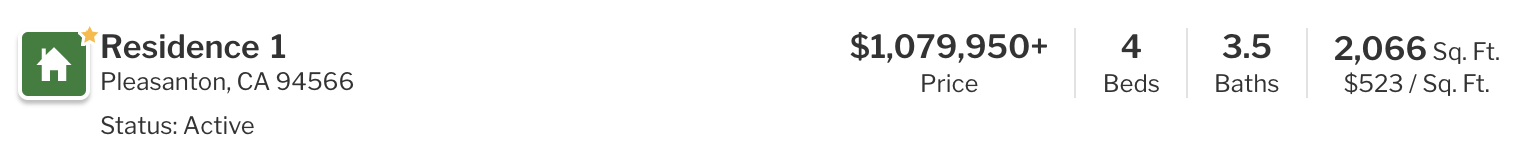
Same config house in similar neighborhood cost 1/8 of SV.
Property tax is lesser too. Rate in Austin twice of CA. Price of house is 1/8. Hence property tax in absolute dollar is 1/4 of SV. Surprise!
If you’re moving from SV to Austin and has a Primary in SV, selling that Primary would allow you to buy a Primary + 6+ rentals. Instant stream of passive income.
Price of house is 1/3 to 1/2.5, not 1/8. Salary and stock grants will get adjusted downward once you left the Bay. I saw people in the know here said 20% down.
By housing costs I guess you meant cost to buy a house? Yes, that would drop more steeply compared to renting, because 1) there is a natural lower ceiling for rent and 2) rent is dropping in the Bay but not for house prices.
I think it will help to have specific examples. I don’t know much about Austin. What’s the equivalent of Pflugerville in the Bay? Is it similar to say Evergreen in San Jose?
One more thought. That 20% discount on TC will bite you more as you progress on your career. 20% of 400K hurts much more than 20% of 150. But housing costs is sorta constant if you take out a fixed mortgage. The only significant varying part is property tax. Thanks for Prop 13 it’s a non-issue here in the Bay. Not so for Texas.
I think it’s more complicated. The ultimate question is how much you’re putting into savings each year as well. And you need to consider the retirement plan.
If you are only renting and can save $20K/year in Austin and $20K/year in SF Bay Area living the same lifestyle, they’re equal. If the BA means saving only $10K/year, then go to Austin. If the house in Austin is twice the size, go to Austin.
If you can buy, then you need to consider lifestyle–if you get twice the square footage in TX for half the price and you intend to die in that house, go there. If you intend to sell your BA house to pay for your nursing home, stay here.
Overall, though it’s all about savings.
At our age, my parents were banking half their paychecks. They’d paid off their house by the time I was 2 years old. That was NM. We’ll be paying this house off until we’re 80. But when we sell it, we’ll have the same amount they have to retire on. But no house. (Actually, they may very well have more $$ than we will and they’ll have done it in NM)
Wow. What amazing analysis could comparing average to average as if they have the same qualifications and are doing the same job. They should compare same job to same job.
The funny thing is Seattle couples have higher income than the Bay Area, there’s no state income tax, and homes are cheaper.
FB just tried to poach me to move back to Bay Area. It was completely unappealing. TTC was a whopping 5% higher. I thought they were supposed to be at the top of the pay scale.
also should add, making 300K is much easier in BA than Austin comparatively. If you have right skills, be it SWE, ML engg, product mgr, DS, Applied scientist etc. BA is the place. If a person thinks he’s good with 140K then Austin might be better (excluding climate and other factors)
Saw one blind post of Airbnb engineer making 700k, which can never happen for an engineer in Austin.
Yes, that’s the optionality of being in Bay Area. Maybe you will bump into some founder in a Meetup. Maybe your coworker told you about a hot startup he’s moving to. That may or may not happen. So it’s like a call option with a strike price far above market. It’s worth something.