.
![]()
Yes, I am waiting.
.
![]()
Yes, I am waiting.
Come on, people still want to “pay themselves” instead of paying rent. So, to say that housing demand is somehow gone is ridiculous. If rent continues to go higher, again that desire to want to buy becomes even stronger. As soon as these folks either save a tad more or if the mortgage rates recede like my hairline they will be right back in the market.
I still believe our market here in the BA is actually really unique. Too many people want to live and work here. We are not the Vegas’s of the world where yes prices do go up and down like a yoyo.
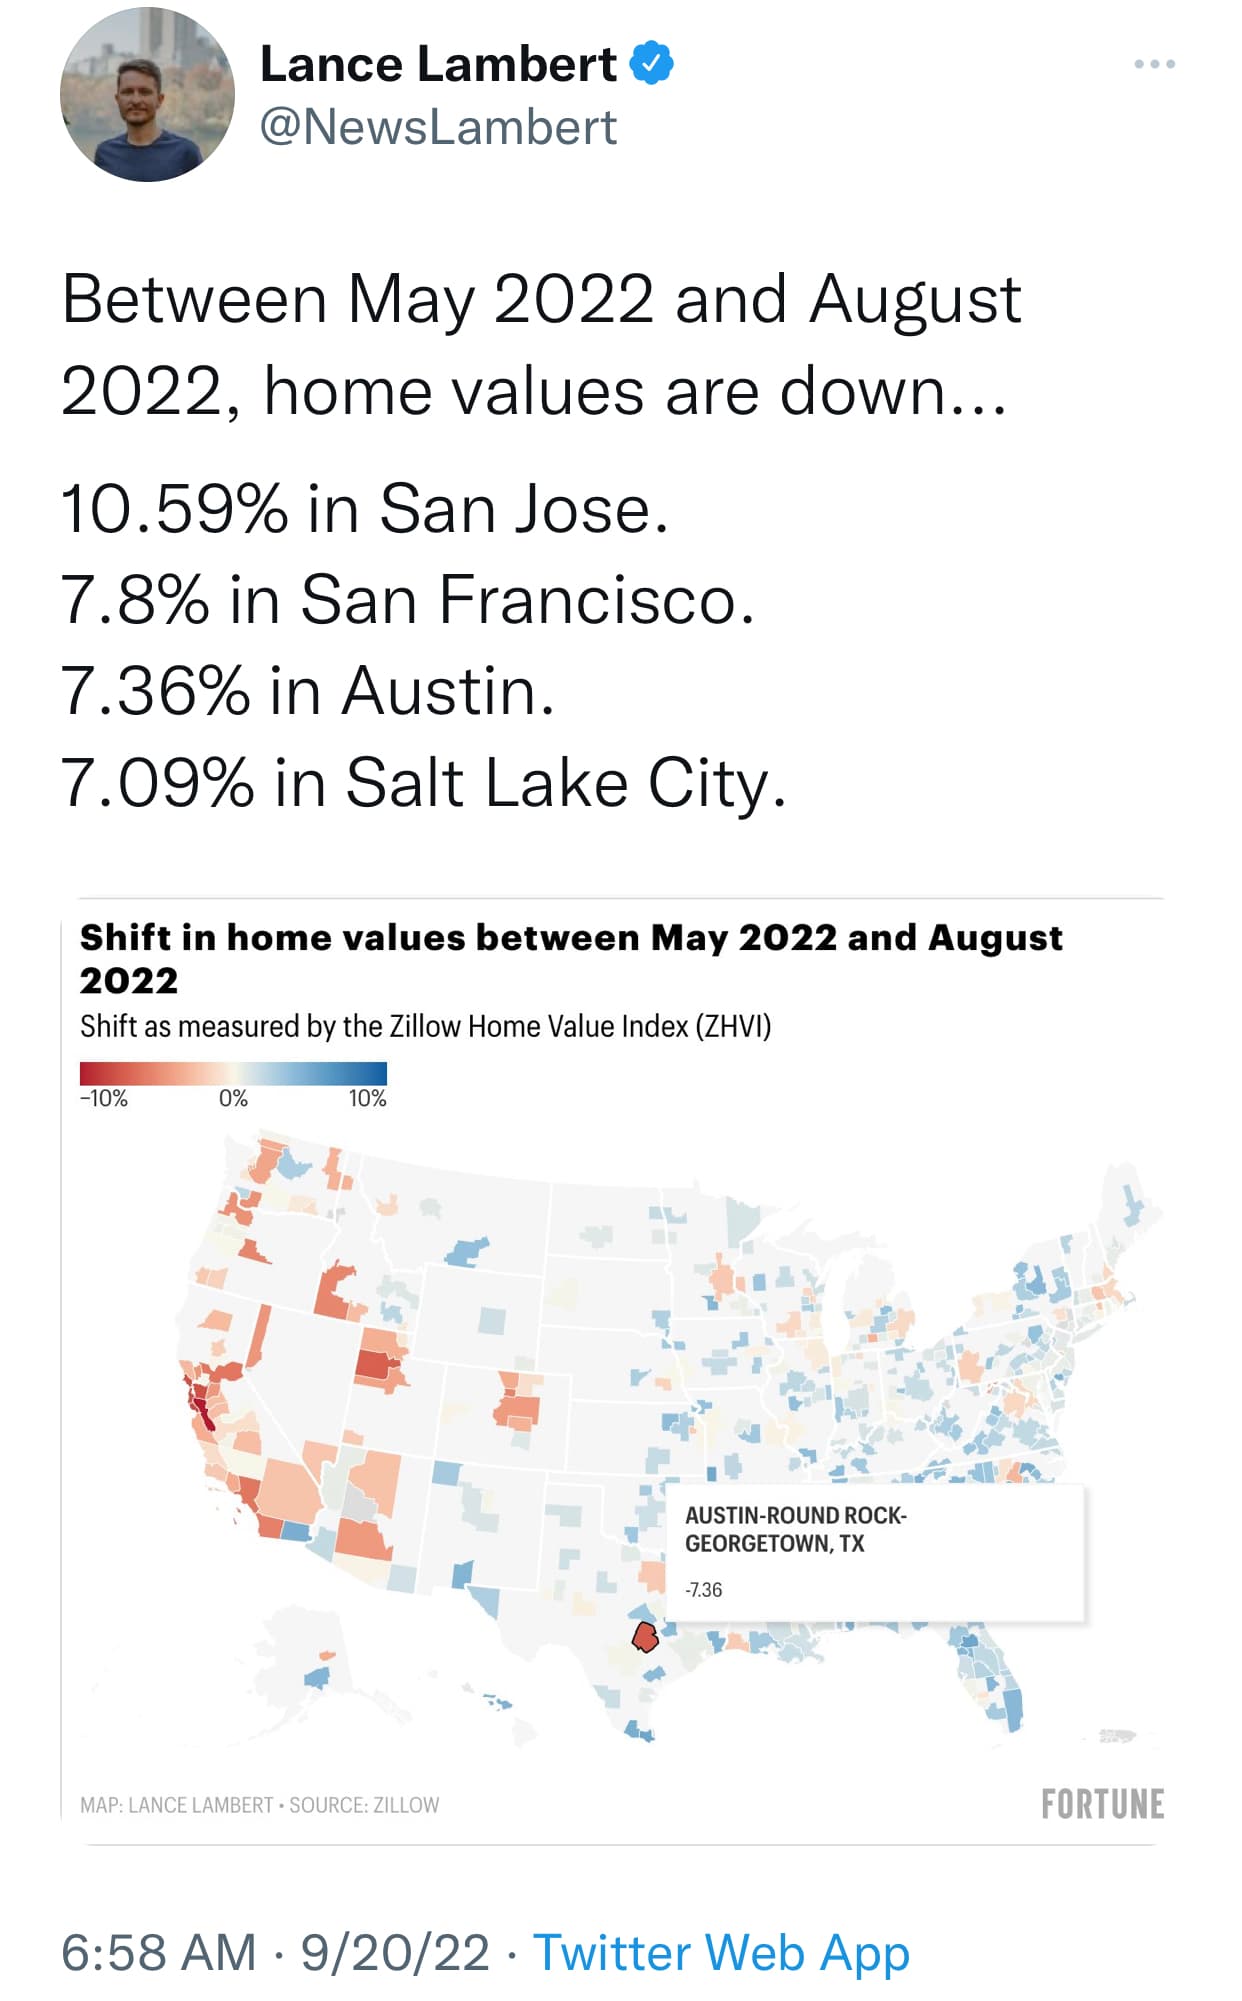
I laugh when the supposedly correction in SF is what 7.4% in price? Wow, ok, sky is “falling” over 7.4% and that assumes it even happens or doesn’t correct itself lickety split…
Price drops only matter at the sale. 1% of SF homes sell per year. The 99% don’t need to worry about price drops demanded by greedy buyers on this forum and elsewhere. I think the most important leading indicator for house prices is the unemployment rate. Still stable. In fact in 1975 it was 10% and prices went up. 2008 house price crash was unique because of bad loans encouraged by the FED. Now people have the greatest equity in history and an historical record low of borrowers under water. What will drive prices down?
Especially more than 20%… basically to last years prices?
Nominal home prices will most likely stay flattish for the desirable areas. But adjusted for inflation their real price will go down big.
That’s usually how housing market correction goes. Nominal price is sticky. They will correct thru real price instead.
Adjust for inflation and everything will go down in price. That’s what inflation is a thief… basically a hidden tax… AKA … the Biden Tax
I think GS comment is nationally not BA or SF.
RE is local. Can’t apply what likely to happen locally to disprove what will happen nationally or what might happen elsewhere.
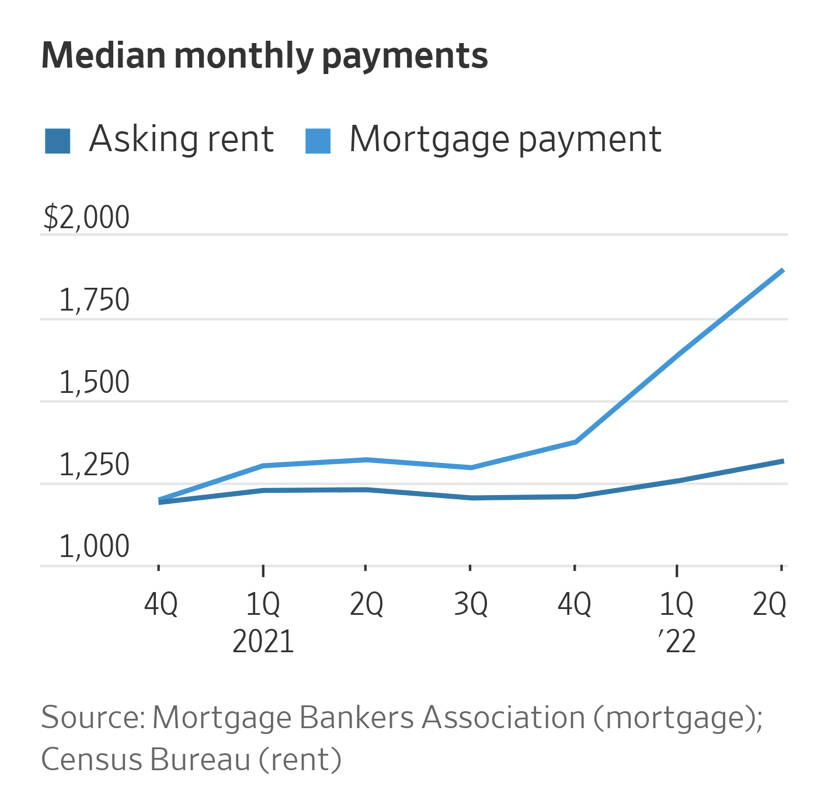
The costs of buying and renting have both risen rapidly, but mortgage payments are the highest on record relative to rents
Mortgage payment is so much larger than asking rent that it has shaken my firm belief that you always buy a Primary when you can afford it.
San Jose metro mortgage payment going vertical. Median monthly payment approaching 10k. And the Fed is not even done.
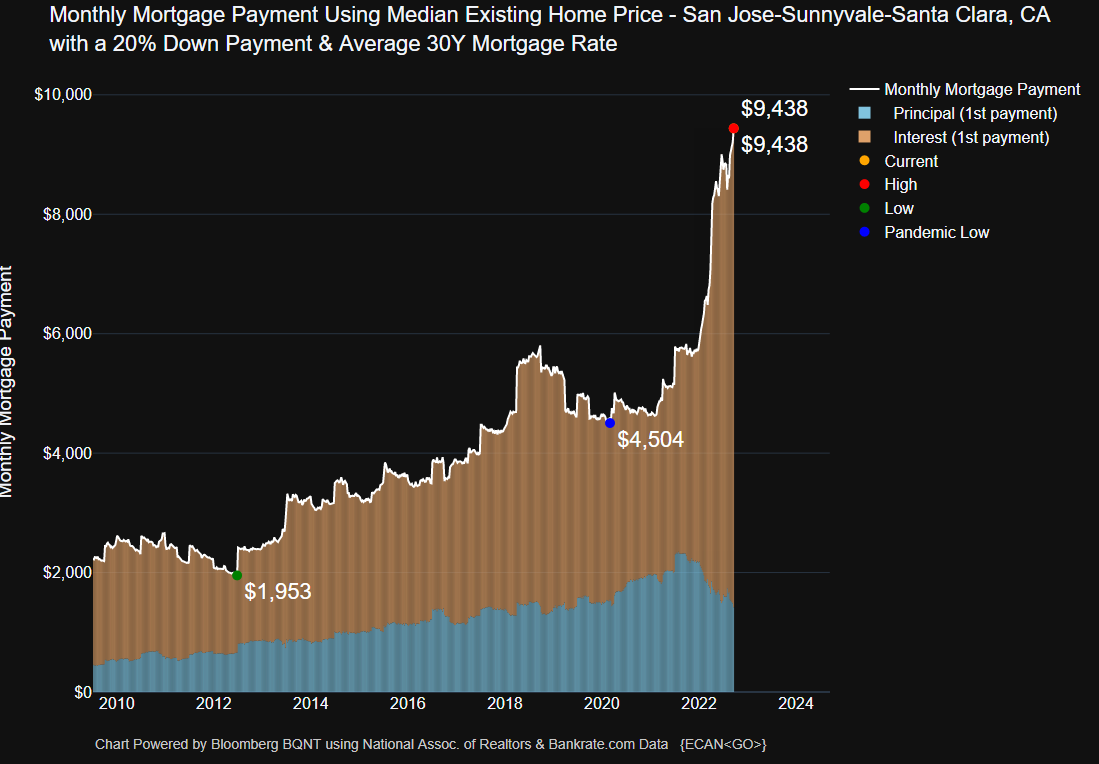
So a family needs to make 200K pretax just to make the mortgage payment. Oh, property tax and insurance are not included above. Need a second job for that, plus you know food and gas.
Seems to me buying today is the financially irresponsible choice. Renting makes much more sense.
I thought everyone in the Bay Area makes $400k so $800k for dual income couple. Home prices can at least triple. ![]()
SJC metro area highest loss in value from May to August 2022.
I’ve been noticing some new rentals SFH while the ads for rental are no longer on zillow, there are no cars on the driveway or lights turned on at night.
Zillow Home Values Index declined on a month-over-month basis two months in a row for the first time in a decade. YoY still up though.

I downloaded the latest Zillow home value forecast. It’s seasonally adjusted. The last number is what they think home value will change by end of August next year.
It’s a pretty big table. I didn’t post the whole thing. Note that both SF and SJ are forecasted to dip 4% one year from now.
| RegionID | SizeRank | RegionName | RegionType | StateName | BaseDate | 2022-09-30 | 2022-11-30 | 2023-08-31 |
|---|---|---|---|---|---|---|---|---|
| 102001 | 0 | United States | country | 2022-08-31 | -0.1 | -0.7 | 1.4 | |
| 394913 | 1 | New York, NY | msa | NY | 2022-08-31 | 0.0 | -0.8 | -0.8 |
| 753899 | 2 | Los Angeles, CA | msa | CA | 2022-08-31 | -1.1 | -3.1 | -2.2 |
| 394463 | 3 | Chicago, IL | msa | IL | 2022-08-31 | -0.1 | -0.7 | -0.9 |
| 394514 | 4 | Dallas, TX | msa | TX | 2022-08-31 | -0.4 | -0.9 | 2.4 |
| 394692 | 5 | Houston, TX | msa | TX | 2022-08-31 | 0.1 | -0.2 | 1.3 |
| 395209 | 6 | Washington, DC | msa | VA | 2022-08-31 | -0.3 | -1.1 | -1.3 |
| 394856 | 7 | Miami, FL | msa | FL | 2022-08-31 | 0.6 | 0.7 | 3.8 |
| 394974 | 8 | Philadelphia, PA | msa | PA | 2022-08-31 | 0.1 | -0.4 | 0.8 |
| 394347 | 9 | Atlanta, GA | msa | GA | 2022-08-31 | 0.0 | -0.3 | 4.1 |
| 394976 | 10 | Phoenix, AZ | msa | AZ | 2022-08-31 | -1.4 | -2.4 | 2.5 |
| 394404 | 11 | Boston, MA | msa | MA | 2022-08-31 | -0.3 | -1.0 | -0.3 |
| 395057 | 12 | San Francisco, CA | msa | CA | 2022-08-31 | -1.7 | -4.0 | -4.0 |
| 395025 | 13 | Riverside, CA | msa | CA | 2022-08-31 | -0.9 | -1.8 | 1.1 |
| 394532 | 14 | Detroit, MI | msa | MI | 2022-08-31 | -0.4 | -0.8 | 0.7 |
| 395078 | 15 | Seattle, WA | msa | WA | 2022-08-31 | -0.7 | -2.1 | 0.8 |
| 394865 | 16 | Minneapolis, MN | msa | MN | 2022-08-31 | -0.4 | -1.0 | -0.4 |
| 395056 | 17 | San Diego, CA | msa | CA | 2022-08-31 | -0.7 | -1.8 | 0.5 |
| 395148 | 18 | Tampa, FL | msa | FL | 2022-08-31 | 0.3 | 0.1 | 5.3 |
| 394530 | 19 | Denver, CO | msa | CO | 2022-08-31 | -0.7 | -1.4 | 0.5 |
| 394943 | 23 | Orlando, FL | msa | FL | 2022-08-31 | 0.1 | -0.4 | 3.3 |
| 395055 | 24 | San Antonio, TX | msa | TX | 2022-08-31 | 0.0 | -0.2 | 1.9 |
| 394998 | 25 | Portland, OR | msa | OR | 2022-08-31 | -0.9 | -1.8 | -0.9 |
| 395045 | 26 | Sacramento, CA | msa | CA | 2022-08-31 | -1.6 | -3.5 | -1.9 |
| 394775 | 27 | Las Vegas, NV | msa | NV | 2022-08-31 | -0.9 | -2.2 | 1.9 |
| 394355 | 29 | Austin, TX | msa | TX | 2022-08-31 | -1.3 | -2.4 | 1.8 |
| 395059 | 35 | San Jose, CA | msa | CA | 2022-08-31 | -2.0 | -4.1 | -4.0 |
| 394902 | 36 | Nashville, TN | msa | TN | 2022-08-31 | -0.2 | -1.0 | 2.4 |
| 395053 | 47 | Salt Lake City, UT | msa | UT | 2022-08-31 | -1.1 | -2.0 | 1.9 |
| 394619 | 55 | Fresno, CA | msa | CA | 2022-08-31 | -0.2 | -1.4 | 0.9 |
| 394753 | 64 | Knoxville, TN | msa | TN | 2022-08-31 | 0.4 | 0.8 | 5.3 |
| 394399 | 77 | Boise City, ID | msa | ID | 2022-08-31 | -1.5 | -2.7 | 3.9 |
| 395134 | 78 | Stockton, CA | msa | CA | 2022-08-31 | -1.0 | -2.9 | -0.5 |
| 394871 | 102 | Modesto, CA | msa | CA | 2022-08-31 | -0.8 | -2.6 | -0.6 |
| 395068 | 113 | Santa Rosa, CA | msa | CA | 2022-08-31 | -0.9 | -2.6 | -3.6 |
| 395019 | 116 | Reno, NV | msa | NV | 2022-08-31 | -1.5 | -2.8 | 0.0 |
| 395183 | 122 | Vallejo, CA | msa | CA | 2022-08-31 | 0.2 | -0.5 | 0.6 |
| 753917 | 123 | Santa Maria, CA | msa | CA | 2022-08-31 | -0.7 | -2.1 | -0.2 |
| 395050 | 125 | Salinas, CA | msa | CA | 2022-08-31 | -0.8 | -2.0 | -0.6 |
| 395061 | 174 | San Luis Obispo, CA | msa | CA | 2022-08-31 | -0.3 | -1.3 | -0.2 |
| 394851 | 175 | Merced, CA | msa | CA | 2022-08-31 | -0.9 | -2.8 | 0.1 |
| 395065 | 181 | Santa Cruz, CA | msa | CA | 2022-08-31 | -1.7 | -3.9 | -2.4 |
It is just the beginning. I expect 40-50% total decline in Bay Area from ATH. It will be the best thing to happen to Bay Area.
Bay Area house prices dropped @45% between top in 2006 bottom in 2009.
You believe it’s gonna be as bad this time and the circumstances as far as the challenges facing the economy are the same?
His comparison is completely biased with the way he prefers, but not median price comparison !
IMO, it is waste of time discussing such wrong comparison.