Make it the mayor’s job to stop job growth. If there is more than 100 new jobs in SF, fire the mayor and elect a new mayor. If you can find a mayor who can keep job growth at exactly 0%, no job loss and no job growth, just perfectly stable total number of jobs, you can make him or her the pemanrnant mayor. That will create a perfect city of San Francisco, totally fab 7x7!
You forgot 0 profit.
Zero growth is ok with both sides.
Zero profit may anger both the rich liberals and the rich conservatives.
1 Like
I recommend mass job reductions at City Hall
2 Likes
It seems the market cool off has also started in South Bay:
I noticed this after seeing so many price reductions. Below is all the active properties in the market (not yet pending) with price reductions in the last 30 days:
I don’t think I’ve ever seen this many price reductions. Yes, listing price in BA doesn’t mean anything, but that’s because we list low to draw more traffic to open houses. If we restrict to SFHs under 2.5M (to exclude those damn mansions in Woodside, etc), the picture still looks pretty bad:
The aforementioned blog post seems to indicate that we’re getting close to buyer’s market. If the market continues to be stagnant till September-ish, that’s it for this year. 
Not sure how much meaningful this information is.
Out of curiosity, I took one example from your link and looked at below home.
(Somehow, redfin didn’t show me price history.
https://www.zillow.com/homedetails/3441-Julio-Ave-San-Jose-CA-95124/19694399_zpid/
| DATE | EVENT | PRICE | $/SQFT | SOURCE | |
|---|---|---|---|---|---|
| 7/16/2018 | Price change | $1,249,000 | -3.1% | $976 | Sereno Group |
| 7/3/2018 | Listed for sale | $1,288,800 | – | $1,007 | Sereno Group |
Looks like listing agent first focused on Chinese buyers (lots of 8) and then changed it looks less than 1.25M.
I used to saw listing price adjustment quite often even in the hottest market (last Feb/Mar/Apr) sometimes higher sometimes lower.
IMO, what matters is really sold price on similar homes.
They probably adjusted the price so the house would fall under the $1.25M bracket in case the buyers filter their search using that as the upper limit.
I agree that we should be looking at sold prices, but those info is generally >30 days stale due to the time it takes to close.
Looking at any individual property doesn’t give us too much info either. I’ve been meeting with multiple agents in the area, and they all chime that the market has cooled off - that’s slightly better approximation since each agent deals with many properties at any given time.
Watch DOM …probably a better indicator than price.
My guess is people are just buying smaller and cheaper houses. Still high employment, high demand and a shortage of supply. Also look at price per SF
1 Like
In SFBA anything sells fairly quickly. DOM is always LOWER than other areas. However, these indicators clearly signifies we are entering a Negative territory. These are SFH in SJC 3 br+ and 1100-2000 sf with 5300 homes. Last time overbidding of this magnitude was in 2008. Like I said the SJ RE prices have stabilized. Between June and half of July areal price ($/sf) was lowered by -1.9% or -6.5% since end of April 2018.
1 Like
Thanks Sam.
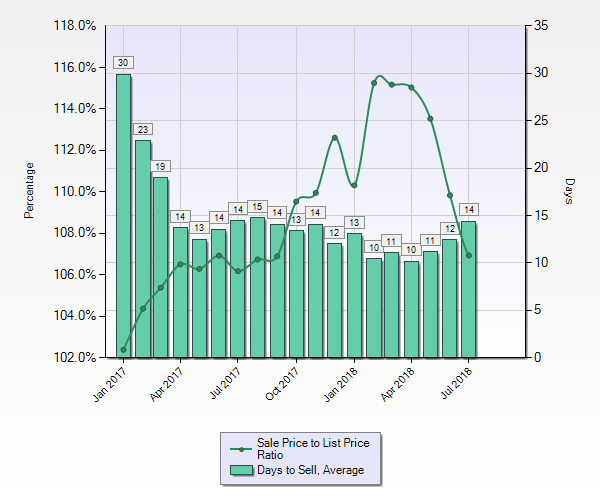
So in 2017 market quickly recovered from one small seasonal dip in summers and came back in fall. The dip is steeper this time. We will know in one month if it will turn or keep going down.
Can you take back this chart to Jan 2016. That would provide clear picture to assimilate the broad dip in 2016.
System down and I need to do my job as a realtor.
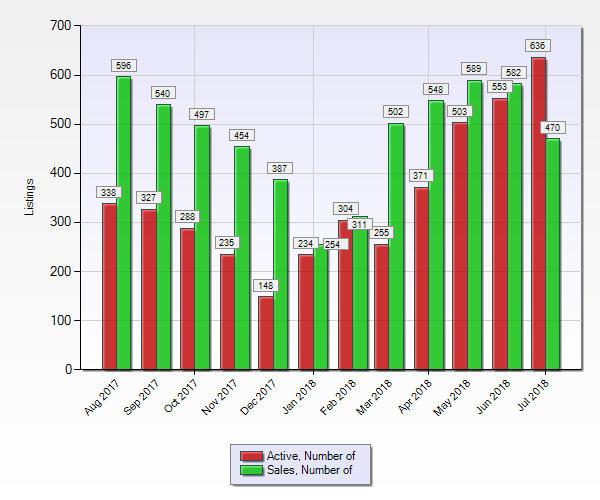
Jan 2016 thru Q1 2017 ratio sold/asked was 100-106%. Summer 2017 all of a sudden there was lower inventory and overbidding continued active through Xmas. Finally it dampened the fever. Following chart is supply vs demand for Santa Clara County SFH(1100-2000 sf).
2 Likes