People have been hyping that for years. The person running it was fired not that long ago. That doesn’t happen when the business is performing to expectations. It’s included with retail for financial reporting purposes. If it is allegedly growing so fast, then how slow is the rest growing to get to the weighted average growth rate?
1 Like
Essentially pundits are attempting to resuscitate the dying monkey by reiterating the past reasons that had brought AMZN to glory 
1 Like
AAPL is extra-ordinary lead last year, missed the boat to buy at $142 or hold whatever I bought around $148. This is stock of the year 2019 !
I have the habit of buying any stock when it dips, but not buying any stock (including AAPL) when it is up. Since $260 AAPL was going up. I never look at any stock going up and up (including AAPL and TSLA).
However, there are plenty of stocks I buy (when falls sharply like yesterday TEVA) and gain. Since AMZN fell, I purchased it.
Again, all my purchases are triggered by my computer when it dips, I just review and initiate a buy.
Can your program gives early warning? If I am not wrong, your program behaves like candlestick pattern, need an indicator like divergence. Candlestick issues a signal when it confirms a trend while divergence suggests a trend change. You need three indicators:
. Impending trend change
. Confirming a trend
. Still in trend
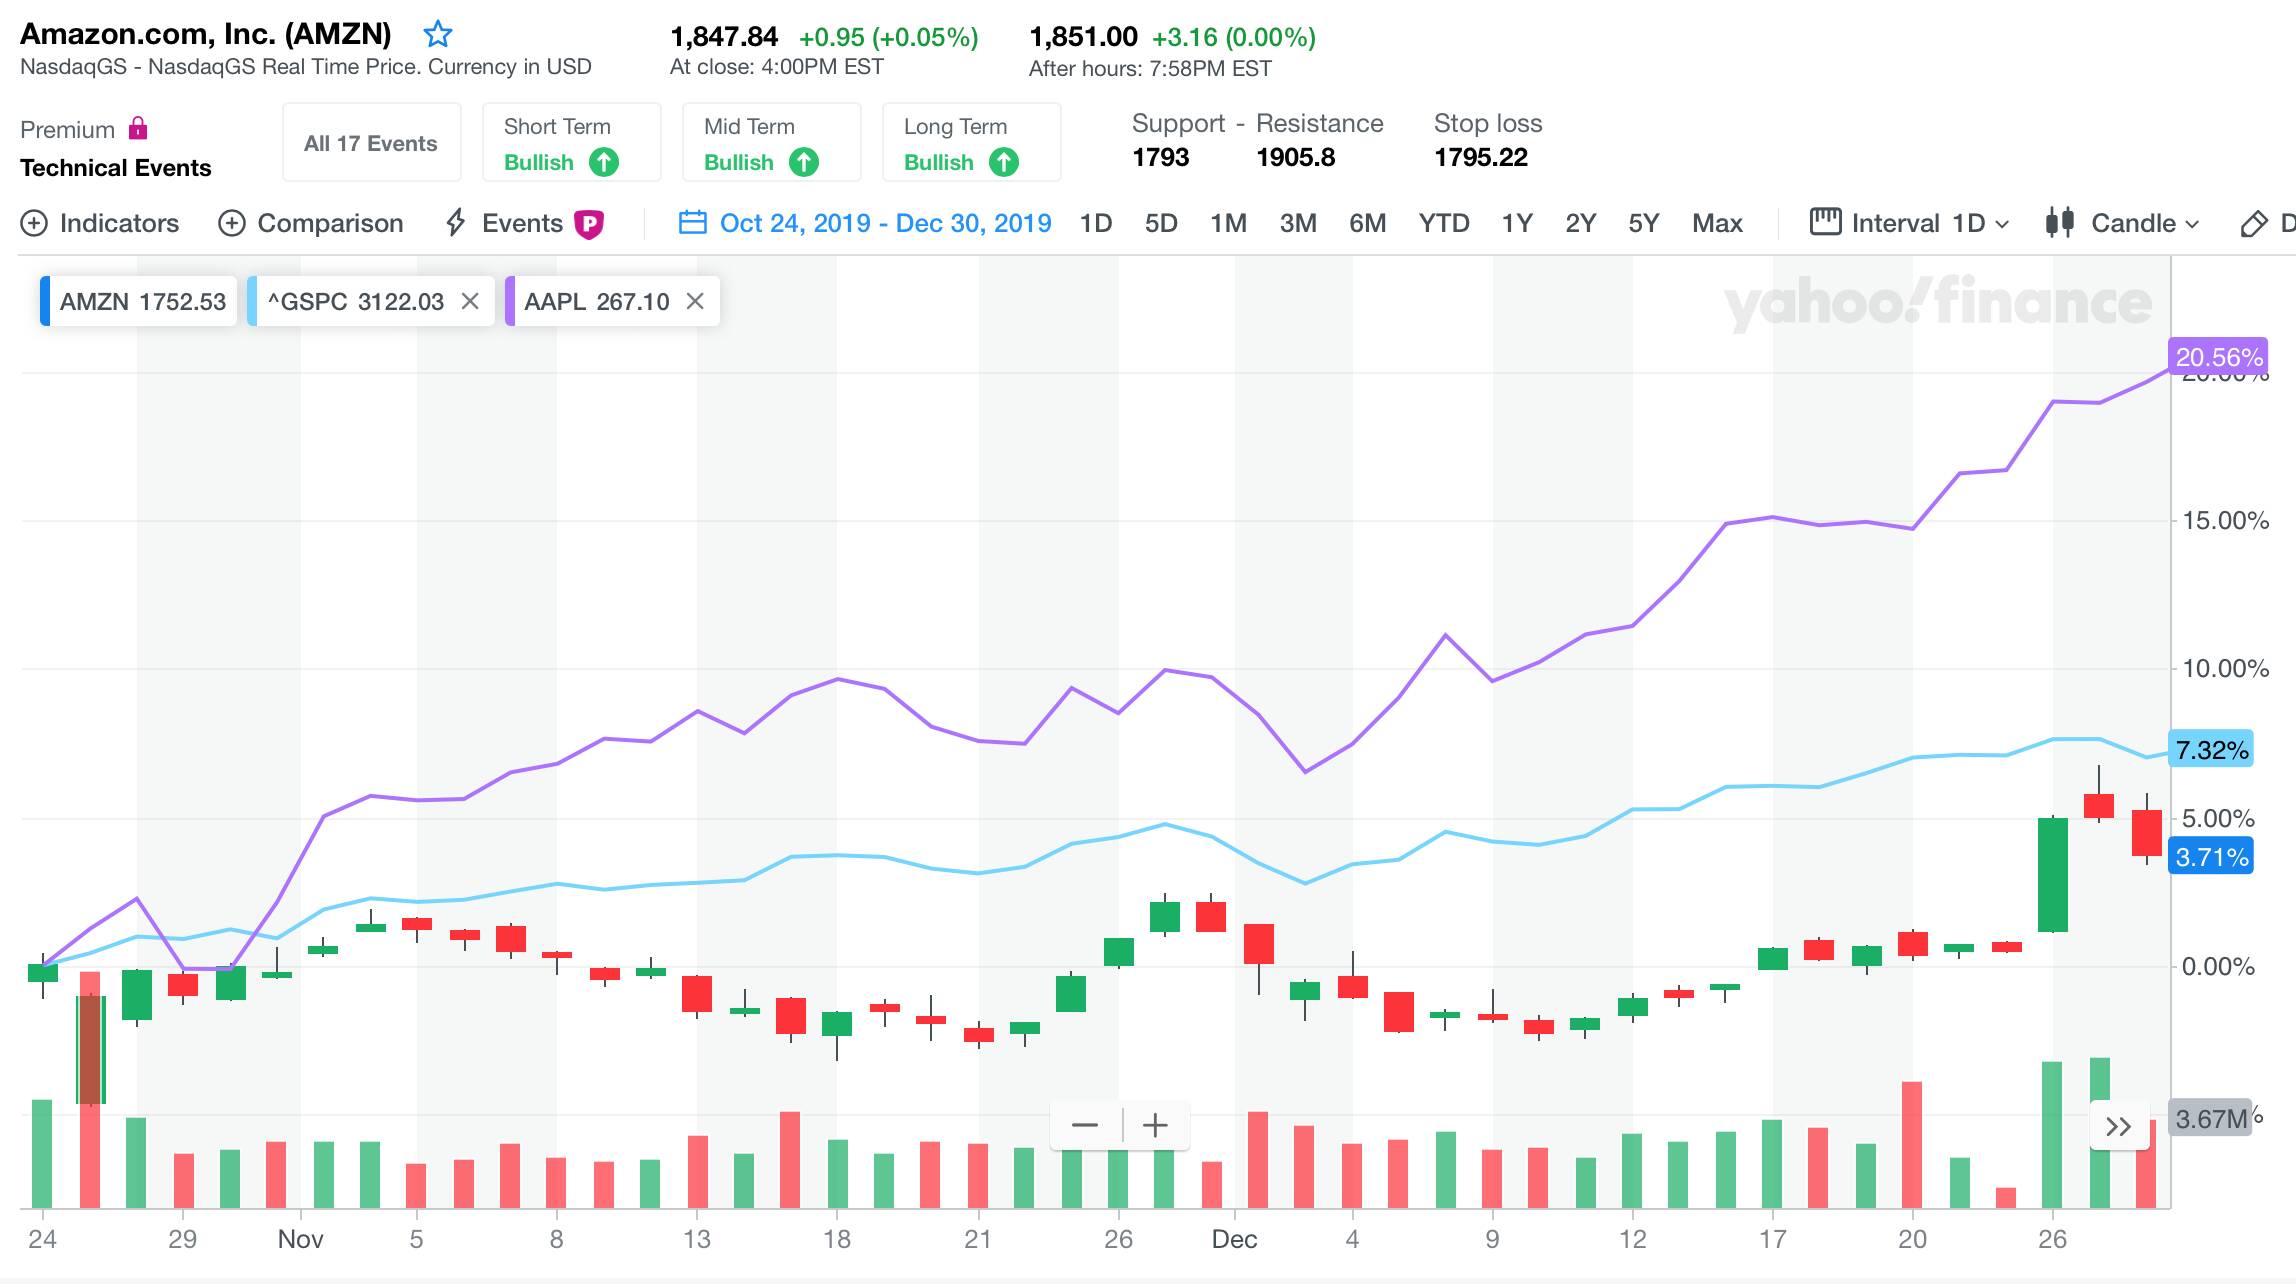
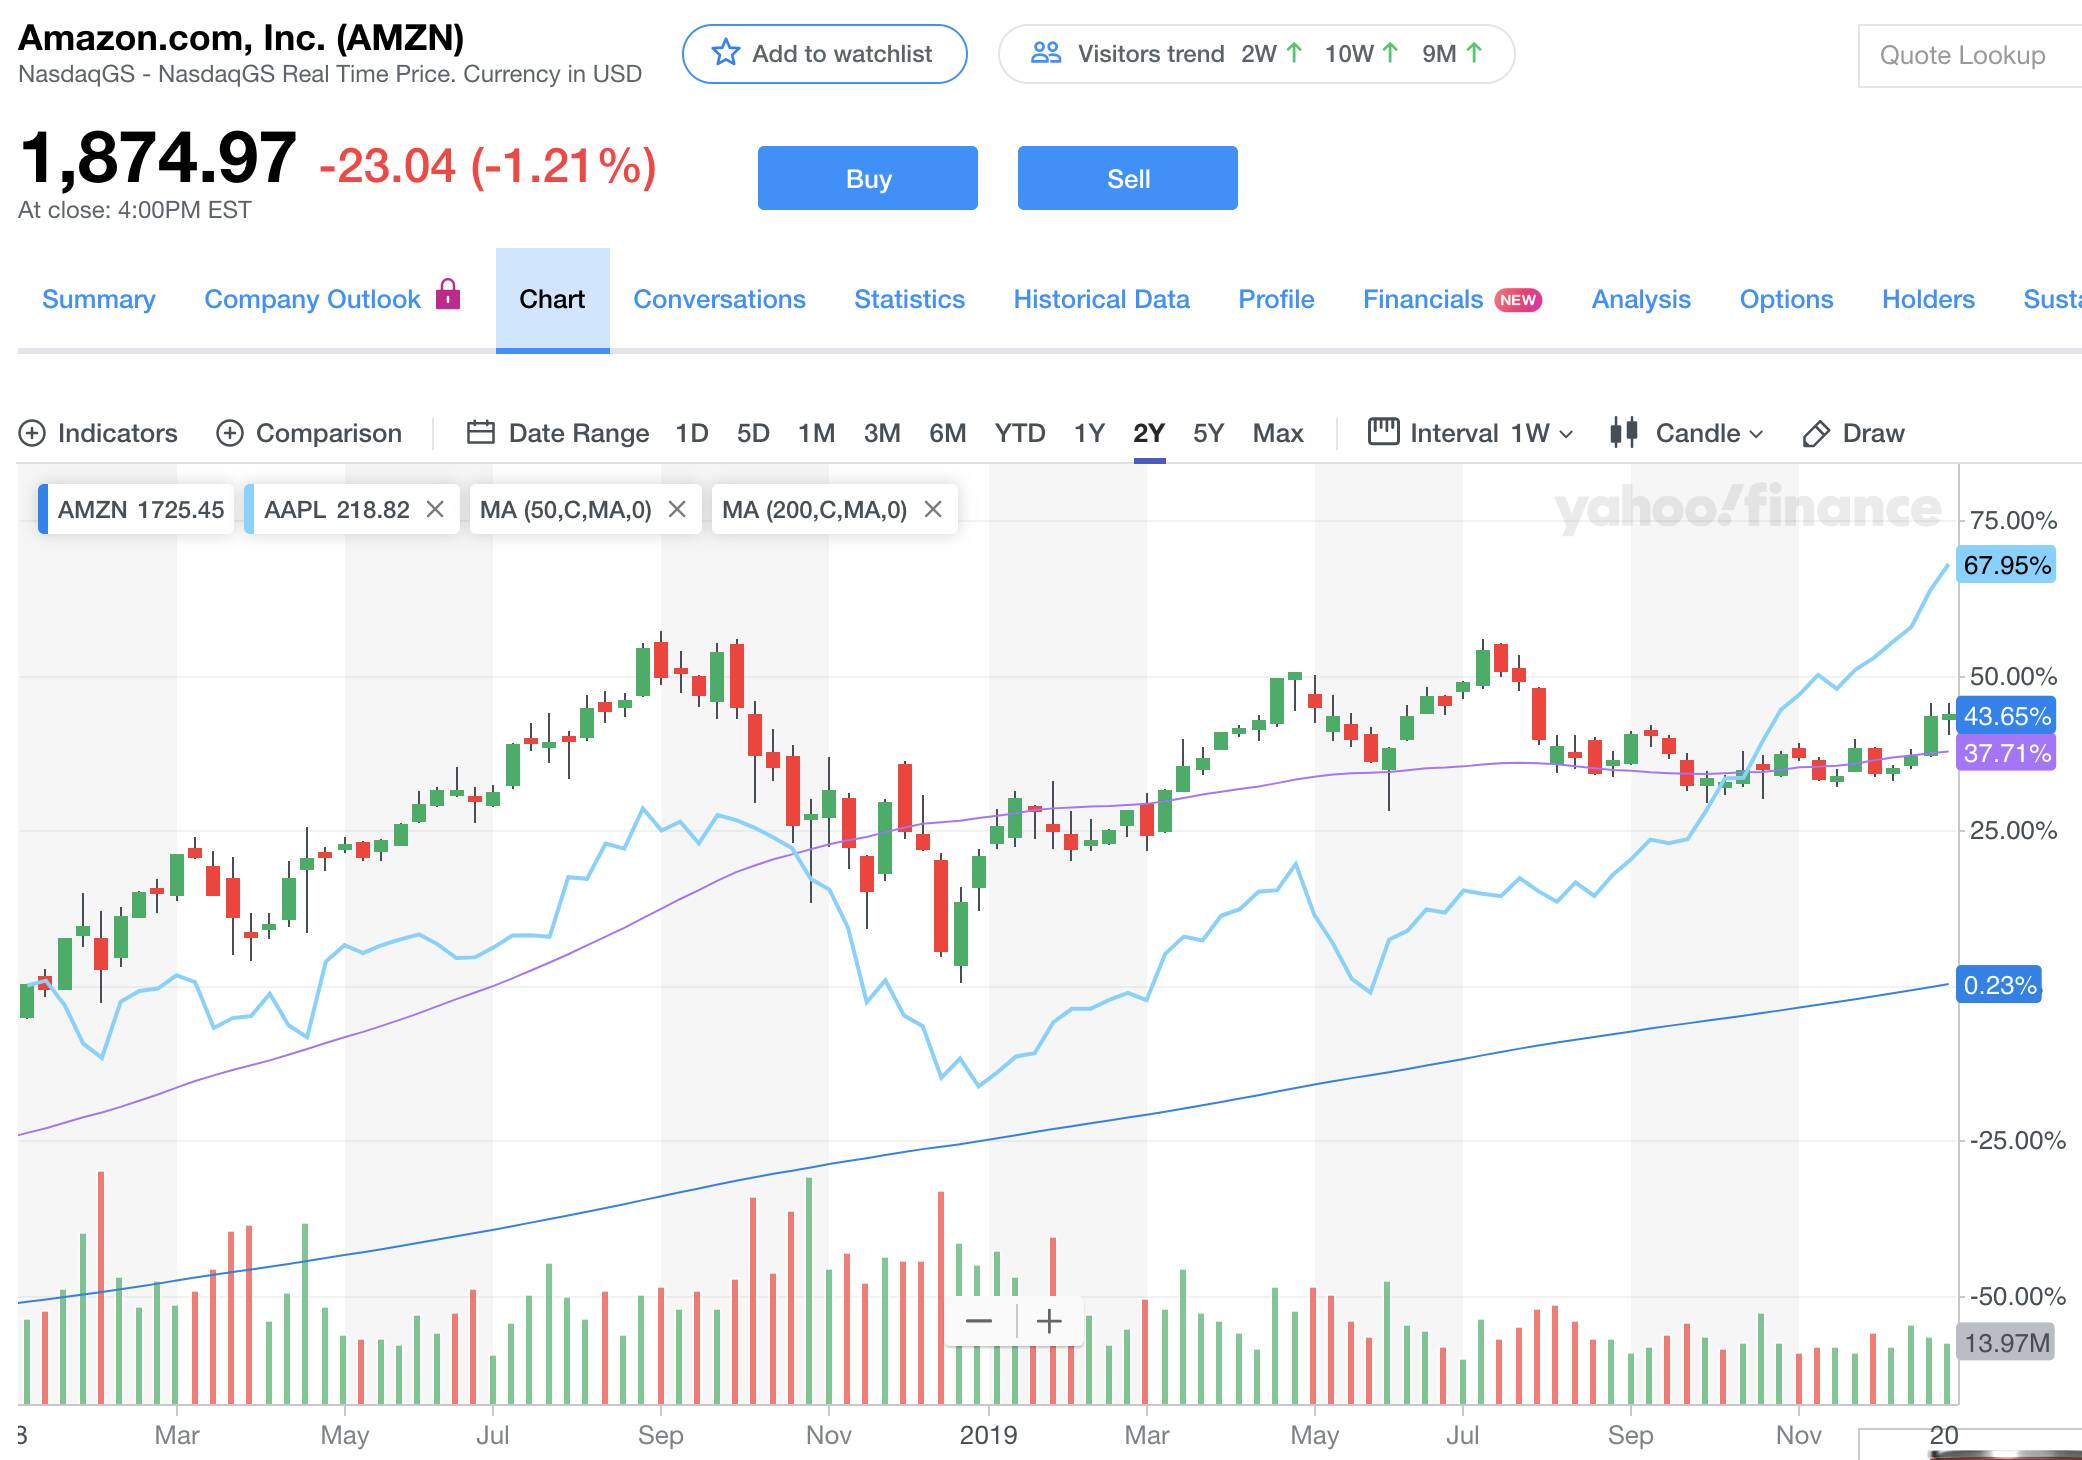
So much Apple chest thumping for what? If you zoomed out a little bit, AAPL only pulled ahead of AMZN since October '19.
1 Like
It has both FA (simplest DCF) and TA, but not EW, lot of indicators are mixed. Reg warning, it sends me a text message with various status when Impending trend change and silent other times. As usual to many algorithms, it has some bias or flaws, which I need to manually review.
The biggest regret is when AAPL was $142 or $172, I did not have this programs in place (as I was half way through). Otherwise, instead of selling at $148, I would have held it nicely.
1 Like
How to find these. BTW what is the difference between “Confirming a trend” and “Still in trend”. To my untrained mind, both sound same.
Confirming a trend has changed, is a follow up to impending trend change. Once in a trend, need to know that it is still in the same trend. Sometimes there is sudden price change, it may or may not change the trend, so confirming the trend is a must. Depending on your trading preferences, the conclusion can be different e.g. Multi-month uptrend, multi-week downtrend, multi-day uptrend. So you can have three positions for the same stock, long underlying to ride multi month, long puts (1-3 months away) to ride multi week, and long weekly calls to ride multi days.
2 Likes
No need to know EWT in depth, incorporating fib ratios will do. 0.382, 0.5, 0.618, 1, 1.618 are the most important ones. These are the numbers where change in trend is likely.
Fib ratios are approximations, but not at all accurate. They are good for visuals, as mind is master computer, but not for computing.
Many algo used fib ratios according to a blogger who claimed to work as a SWE for a trading company in WS. He no longer work there.
I am NOT telling it is not used or it is wrong. Fib ratios are approximations, but not at all accurate. Mostly, the inaccuracies are removed by human review. To win a trade, you need more precision/accuracy.
Even after years of work, I am struggling with accuracy issue or some bias (very common).
See how Jim Simon made billions employing mathematicians.
1 Like
Not sure more accuracies are needed. Definitely reduce bias and improve speed of decision especially when market moves against you.
Thanks for this discussion. Very inspiring.
AMZN business is under siege from everywhere. I don’t know Jeff and his management well, can they overcome all these awakening giants? Jeff was boasting that those giants were sleeping for 7 years, now that they are all awakened, is AMZN still a buy? Price has been sideways for over a year, it means market is not sure too. Need some local wisdom here 
1 Like