LOL. Just social media. Nothing accurate or authentic about it.
1 Like
Nothing new to learn from that Beth guy. The green count is identical to my count and should be the count now… Panda  is onboard. The article is outdated and doesn’t account for today last half hour melt up.
Beware of the century corrective wave  Beth guy is still short term outlook
So can you summarize for me? Too many arrows on your chart. Is it going to be  from now on?
I gave up. Doubt you can understand chart. My count has not change for nearly one month for short-term and have not changed for months for long term. Actually, long term, nothing has changed at all.
I can understand

Vs

Just tell me which. 
Show that you don’t understand trends. I have talked about many timeframes in numerous occasions in this forum. Without stating the timeframe, trends are meaningless… this applies to stocks as well as RE. Multi-day can be down, multi-week is up, multi-month is down, multi-year is sideway, multi-decade is up, …
So what timeframes are you in? @Jil is always on multi-day to multi-week. @pastora is usually multi-day. Multi-week trend is clearly pointing UP now. The century Peak could be in Apr-Jun time frame… The century impulse peak… you can either believe it or laugh at me and Panda depending on what happen from Apr-Jun till next few years. That is, this last final up wave/ leg (recall this been mentioned ad nauseam) is for me to unload BIG TIME into uber euphoria. I believe you don’t have a timeframe in mind so you are confused when reading charts… you don’t know what timeframe people are talking about on the chart.
1 Like
You are liquidating your entire AAPL holding?
![]()
Crossed my mind but my wife would kill me. I have unloaded 50% of AAPLs in my IRA account only. For other accounts, would ride through the corrective wave… AAPL could thrive… recall I say some stocks would strive… AAPL could be one of those.
But if Apple will thrive, and it’s the biggest component of both S&P and NDX, it won’t be the century top.
The two statements contradict each other.
Other stocks are decimated. AAPL is not that big to overwhelm. Remember I don’t know the pattern of the corrective waves… you are assuming what I have said many times (quite tired of repeating myself so many times) not to assume, corrective wave doesn’t mean down down down.
The move together as a group. If apple thrives there is no reason the other FANMAG will get decimated.
May be FAANMG thrive too. May be FAANMG merely go sideways while other stocks decimates. I don’t know. All I know is, those who are outstanding stock pickers will be the winners. Index fund investors, best so-so return for many decades, worse very negative return.
All I say is corrective wave. I didn’t say is uber bear market! I choose my words carefully.
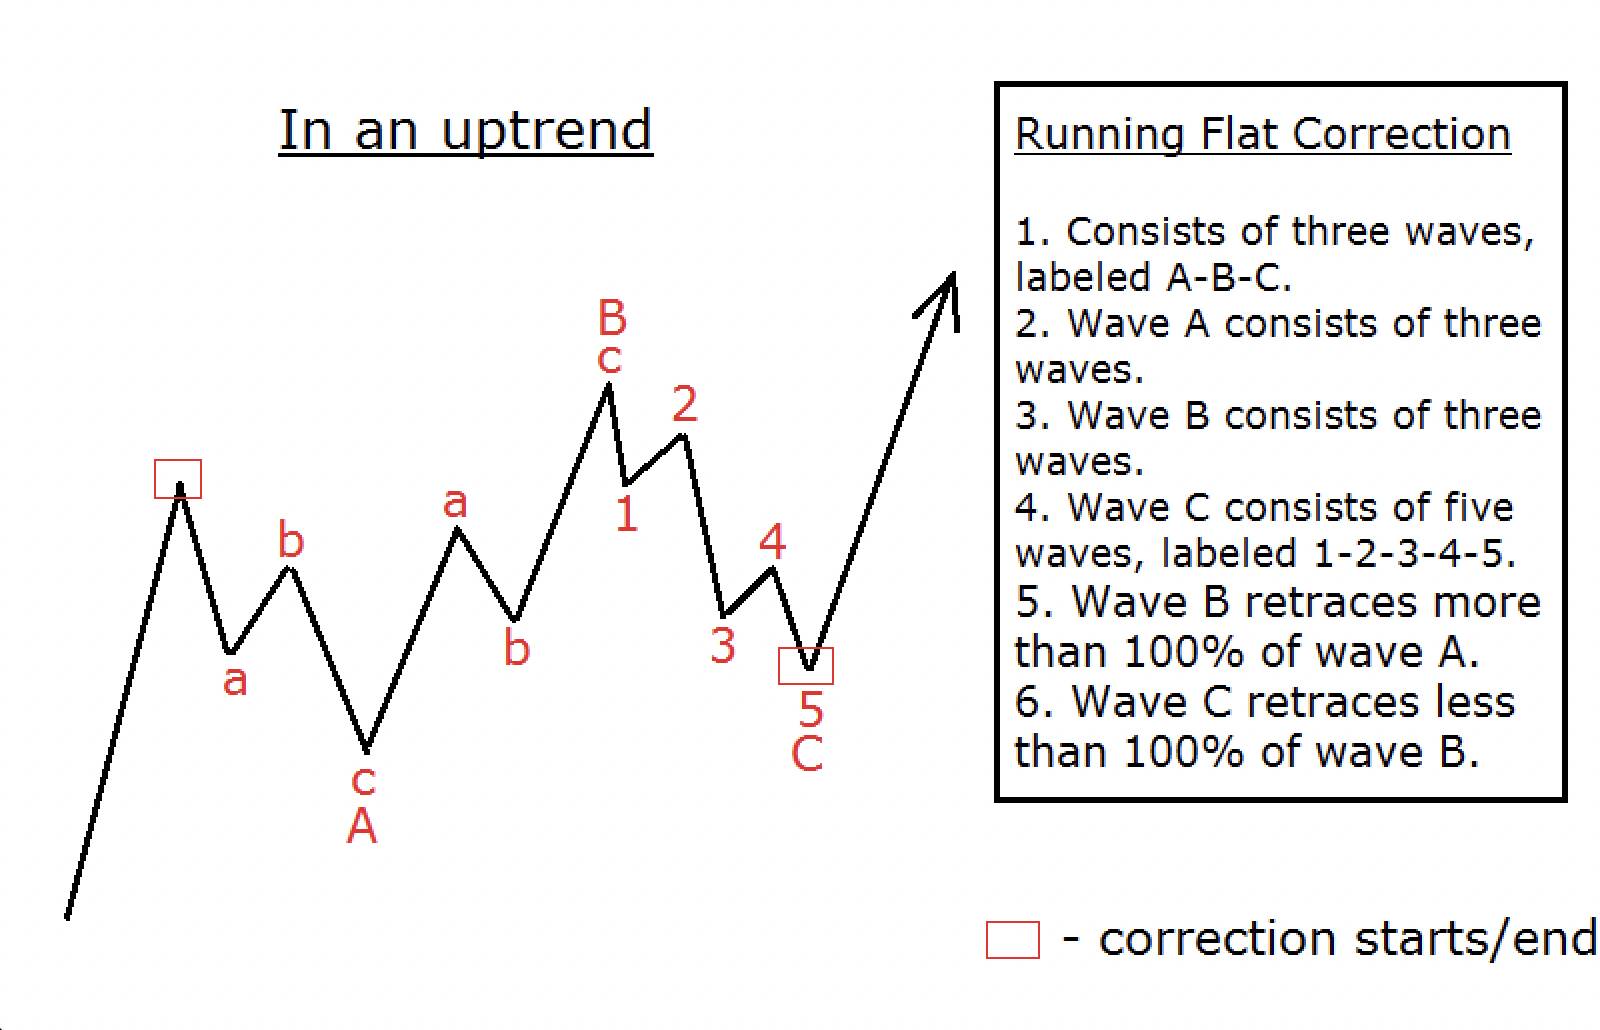
Look at the running flat pattern, imagine is multi-decade long… do you call it a bear market or a bull market?
Now I understand why you don’t understand Jim Cramer, his timeframes can be from multi-week to mulct-year… he didn’t make it clear… is up to you to know by context. Is time for you to start thinking and reading in term of timeframes.
.
Randomly pick a chart posted months ago. Above chart is posted in Dec 20. What does it say?
Multi-month trend is UP… has not changed at all.
Multi-week trend is also UP… till iii which is 337.76 in Feb, then down till early Mar (think is Mar 8).
Multi-day trend is at the point of posting is Up, then down, sideways, up … depending.
Implication? Say for a long only trader,
If you’re a position trader i.e. multi-month timeframe, your aim is to sell at 5, so any dips are BTFDs.
If you’re a swing trader on multi-week timeframe? Be alert, current multi-week is up but need to monitor closely when iii is to be completed.
If you’re a day trader/ multi-day trader? The chart is no good to you.
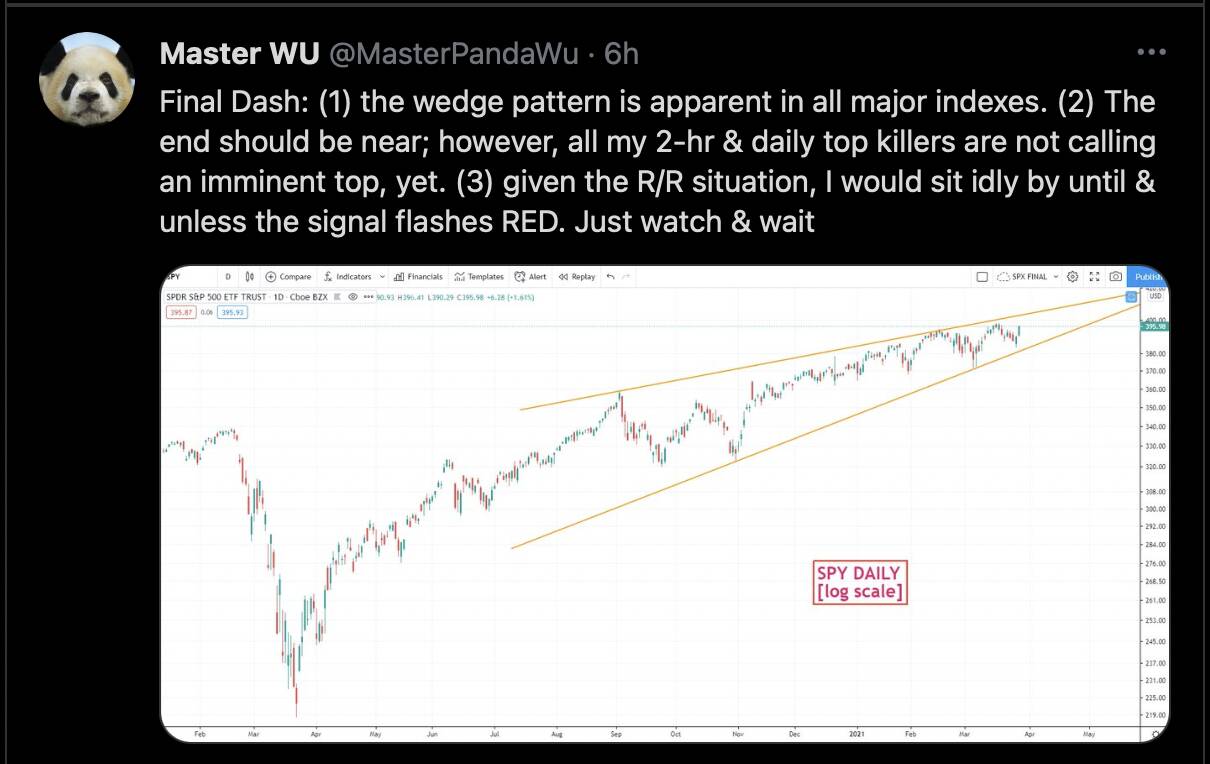
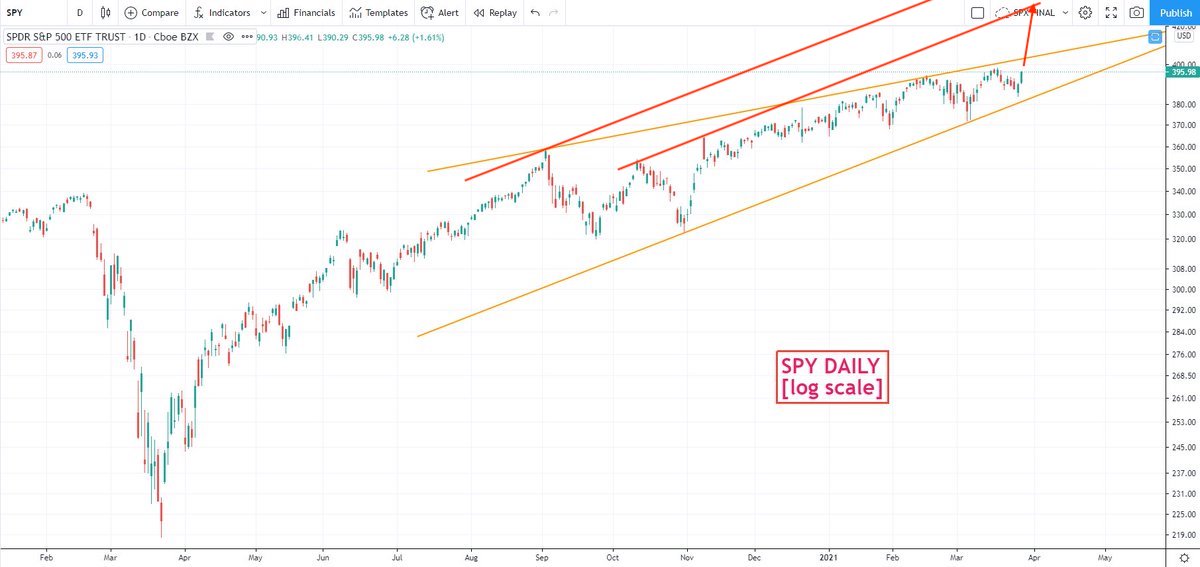
Do Master has some info to be so certain this is going to be a wedge. Could easily break above the wedge as follows:
After some thought, I realize EWT terms are too technical for laymen. So I use laymen’s language to talk (not precise but good enough),
EWT (Elliott Wave Theory) has two types of waves.
Impulse waves - A trend, can be up or down. An impulse has five internal waves.
Corrective waves - A corrective wave has three internal waves. Can be either counter-trend or trend less.
EW waves are nested i.e. within a wave can have impulse and corrective waves.
EW applies to all timeframes (EW calls them degrees), of most interest are:
Primary degree - A multi-month trend, I label them as 1 2 3 4 5
Intermediate degree - A multi-week trend, I label them as i ii iii iv v
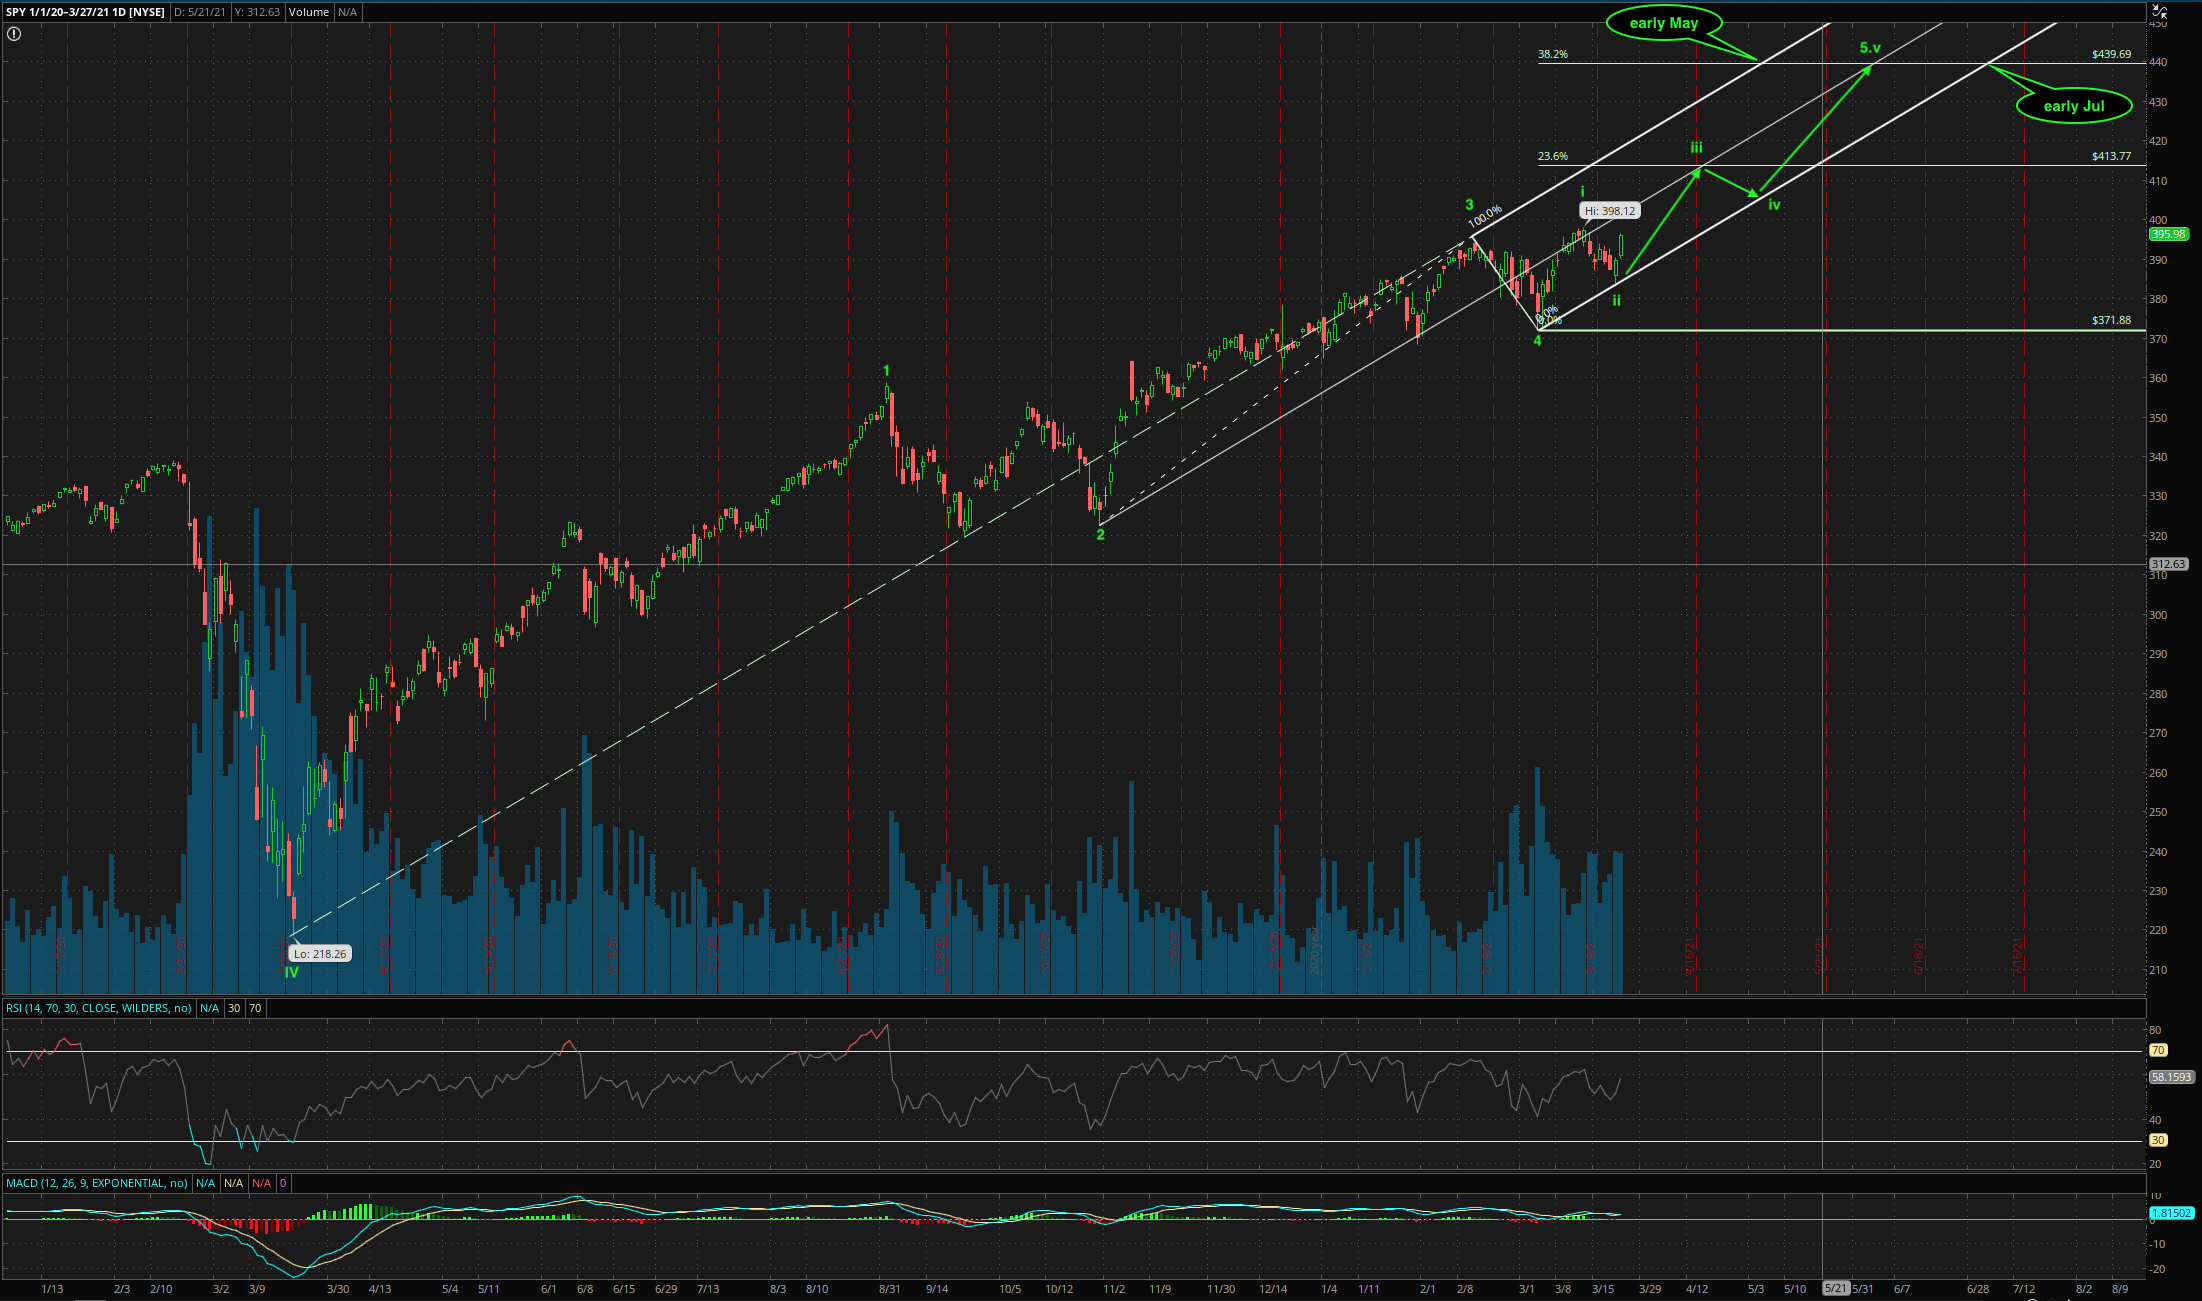
Below is a daily chart for SPY (don’t want to use QQQ and SPX since have too many lines) showing the EW picture since Jan 1, 2020… count is identical to SPX, albeit prices differ… SPY = ~ 0.1 x SPX.
Observations from the chart:
Internal waves of wave 5 is five intermediate degree waves i ii iii iv v
It is in wave 5 i.e. in a multi-month up trend
It is in wave iii i.e. in a multi-week up trend
Prices should travel within the pitchfork channels (don’t ask why, assume is true).
Hence wave 5 is expected to be completed somewhere between early May to early Jul. Most likely Jun 4 Fri
It is likely to be completed at 439.69 (don’t ask why, I have a way to compute).
What happens after wave 5 completes on 6/4?
Jun 4 is my guess. Can happen as early as May 11.
If that is also completion of wave V… CRASH. How fast how deep I have no idea… I will close TQQQs and may or may not long puts. Other buy n hold position, probably just hold on since total amount is small compare to my TQQQ position ![]() Yes, I have lots of TQQQs… go for the kill… very high risk trade. I am cocksure is in multi-month up trend… albeit too eager and didn’t get a very good price.
Yes, I have lots of TQQQs… go for the kill… very high risk trade. I am cocksure is in multi-month up trend… albeit too eager and didn’t get a very good price.
However, could be a wave 1 instead i.e. relabel the waves. Recall I mention that whenever five waves is completed, I am indecisive as to which degree did the impulse has completed even though I have labeled them. Nevertheless, close TQQQs for safety.
Btw, just to jog your memory, I have corrected Panda’s count long ago… his latest tweet essentially say my count is right ![]()
1 Like
I bought a decent size of FNGU and ARKK on Friday during a flush down but I think you’re right. While many traders are confused, some social media furus are predicting a rip toward end of April and early May, then a major correction. I’ll likely go all in with FNGU, ARKK, GBTC and some beaten down chinese stocks. They all have a nice support so easy to setup a stop trigger. Another flush down will be nice but not sure if we’ll get it below the last support. IMO, I don’t think we see the nasdaq hit previous ath in April or May…maybe not for a while.
Looks like Friday morning heavy sell off resulted by Margin call !
GS liquidated 10.5 Billion of Archegos Capital supposedly had 10.5B under management
3 Likes
The bull narrative here is that tech sold off this last week because of an overleveraged home office. The bear narrative here is that this is the beginning of a series of unfortunate over leveraged events.
Which camp are you in?
1 Like