Another believer of S&P is in a bear market rally.
Cut n paste previous post for perspective… pretty sure readers already forgotten about this post.
Another believer of S&P is in a bear market rally.
Cut n paste previous post for perspective… pretty sure readers already forgotten about this post.
With so much of our stuff imported and energy independence in the rear view mirror Americans need to think about currency risk as well.
I have released partial report of magic crystal to public free for review (as long as it is not restricted).
I have not given any help message or explanation. No guarantee or warranty either implicit or explicit.
During market hours, this is updated every 5 minutes (but delayed 30 minutes data).
I would not suggest anyone to trade based on that, but you can know market bullish or bearish turns easily.
At higher level (Monthly ) this may be right, shows last 90 days, but day to day or hour by hour it is moving target (and not reliable esp for recent/latest 6 days).
Site => fn3x.com
Do not ask me any question on logic or any help on this site.
[EDIT] Someone said, “Recessions can be difficult to Predict.”
Just want to give one hint about recession or major correction (15% drop or more), Watch out the “Ranking” column. Tested last 5 years, it was working nicely.
If 5 or more RED “Ranking” days are repeatedly (consecutively) coming, stay out of market for 3 months as market can drop heavily within 3 months.
If 7 or more Green “Ranking” days are repeatedly (consecutively) coming, it is reaching a bottom within 7-30 days.
This site is available until Nov 2023 and if you get recession indicator within that duration, enjoy savings.
I just shared to realestateforums only as that Crystal idea stemmed from here. (no idea/intention to cash out or create a paid basis site). It is a legal hassle and waste of time for me.
Good Luck.
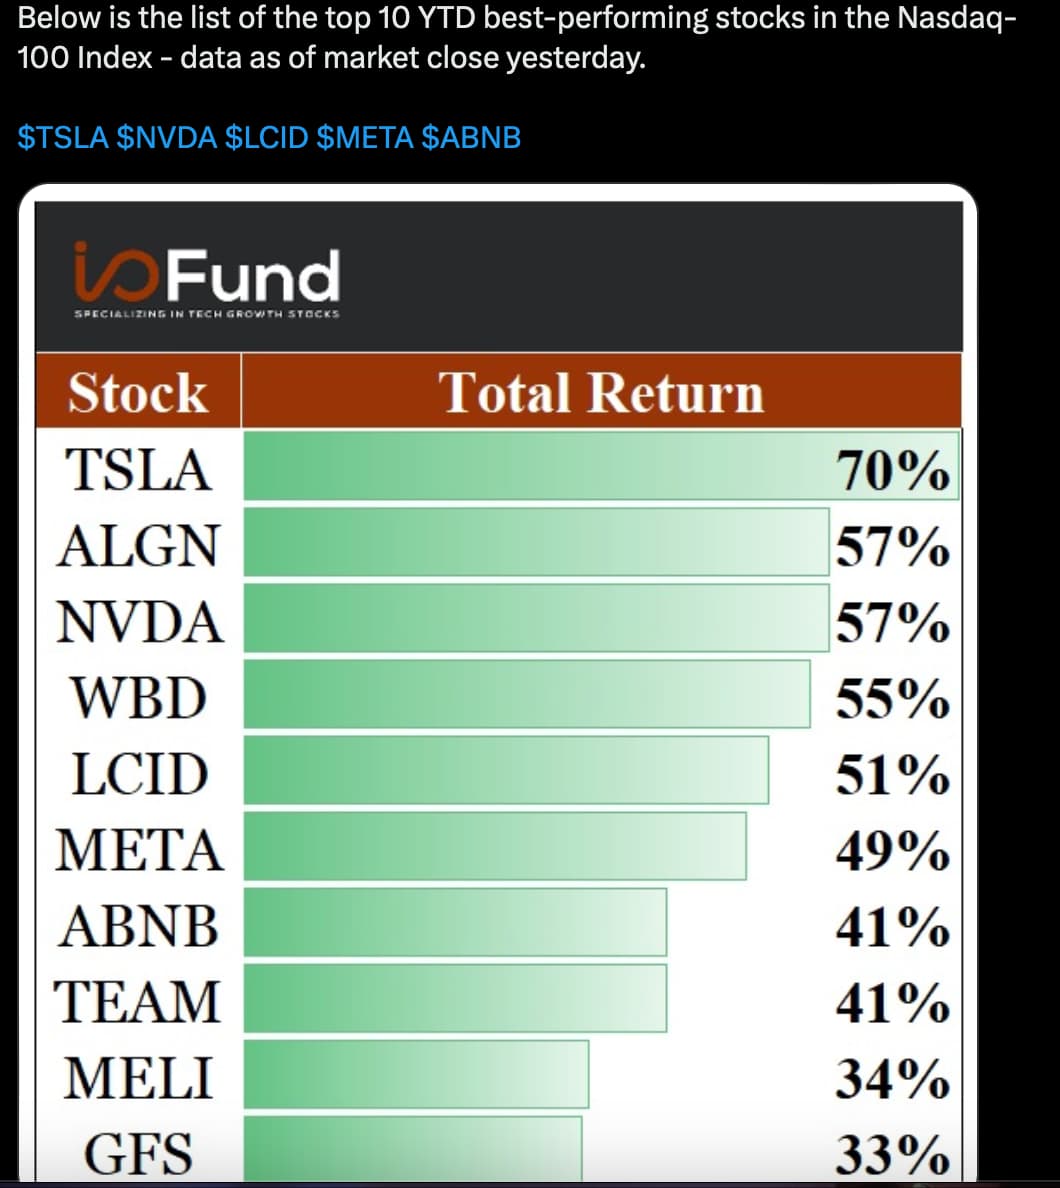
Stocks with golden cross & in confirmed stage 2:
ALGN NVDA MELI GFS
Those above 200-day SMA:
ALGN WBD NVDA META ABNB MELI GFS
Of the list, I own TSLA NVDA ABNB
I realize NET SNOW is not in QQQ.
Some time like yesterday and today, my algorithm fails ( less than six days not reliable ).
Since I know this, analytically which is difficult for quantitative calculations, I stay out of market in cash mode waiting for buying opportunity.
All I know is market is not in good shape! Since I developed software, I understand these issues, but hidden for others.
I need to wait at least 3-6 days for confirmation of direction!
This will work at high level ( month basis ) but not daily. I just want to make sure you understand what is working and what is not working.
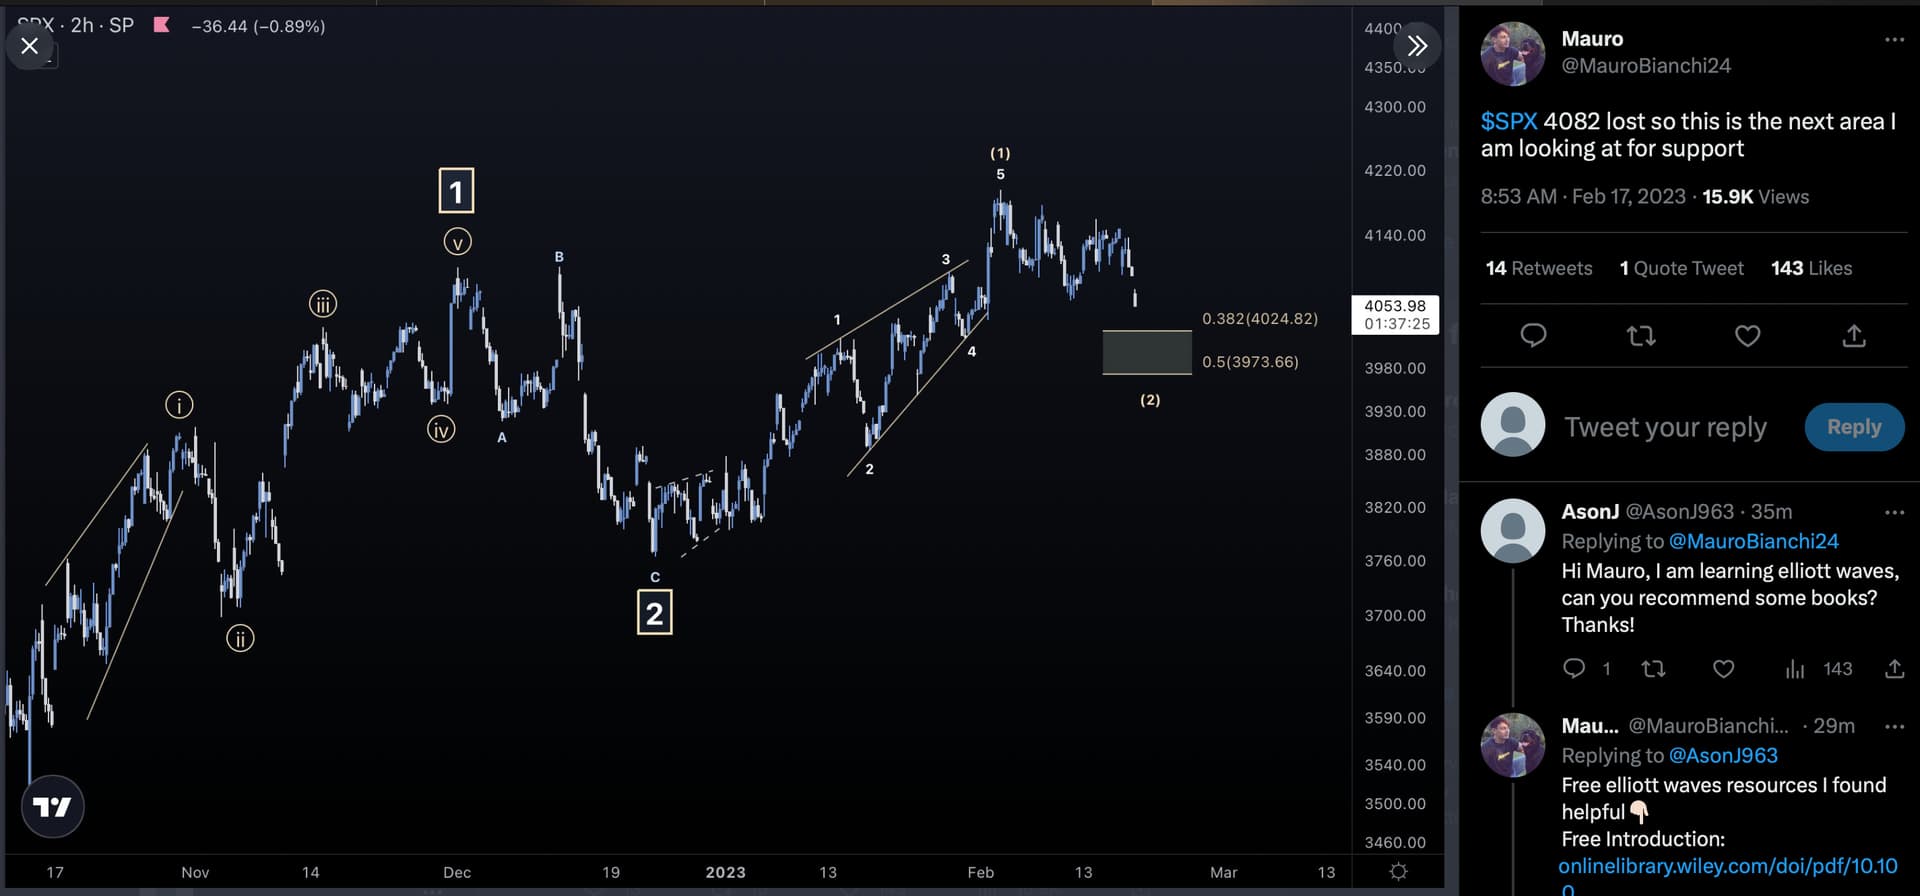
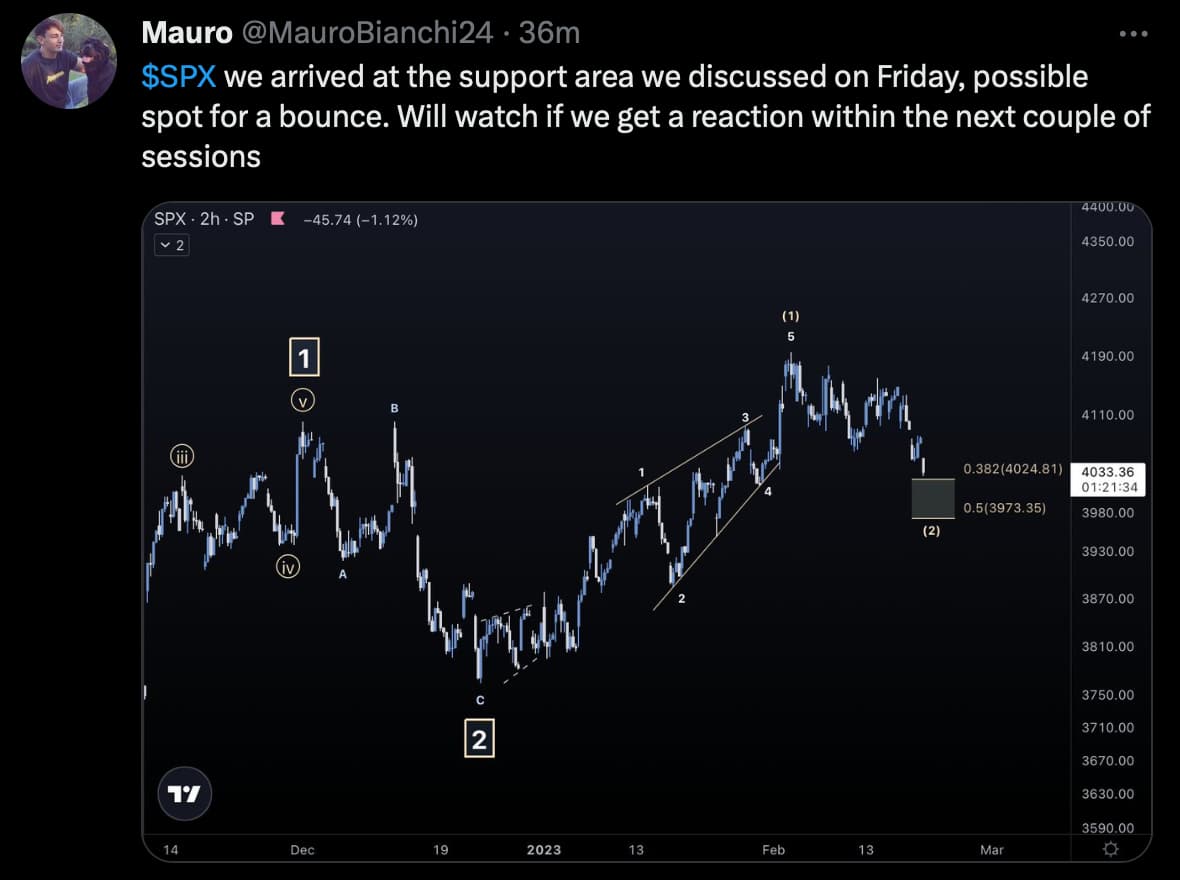
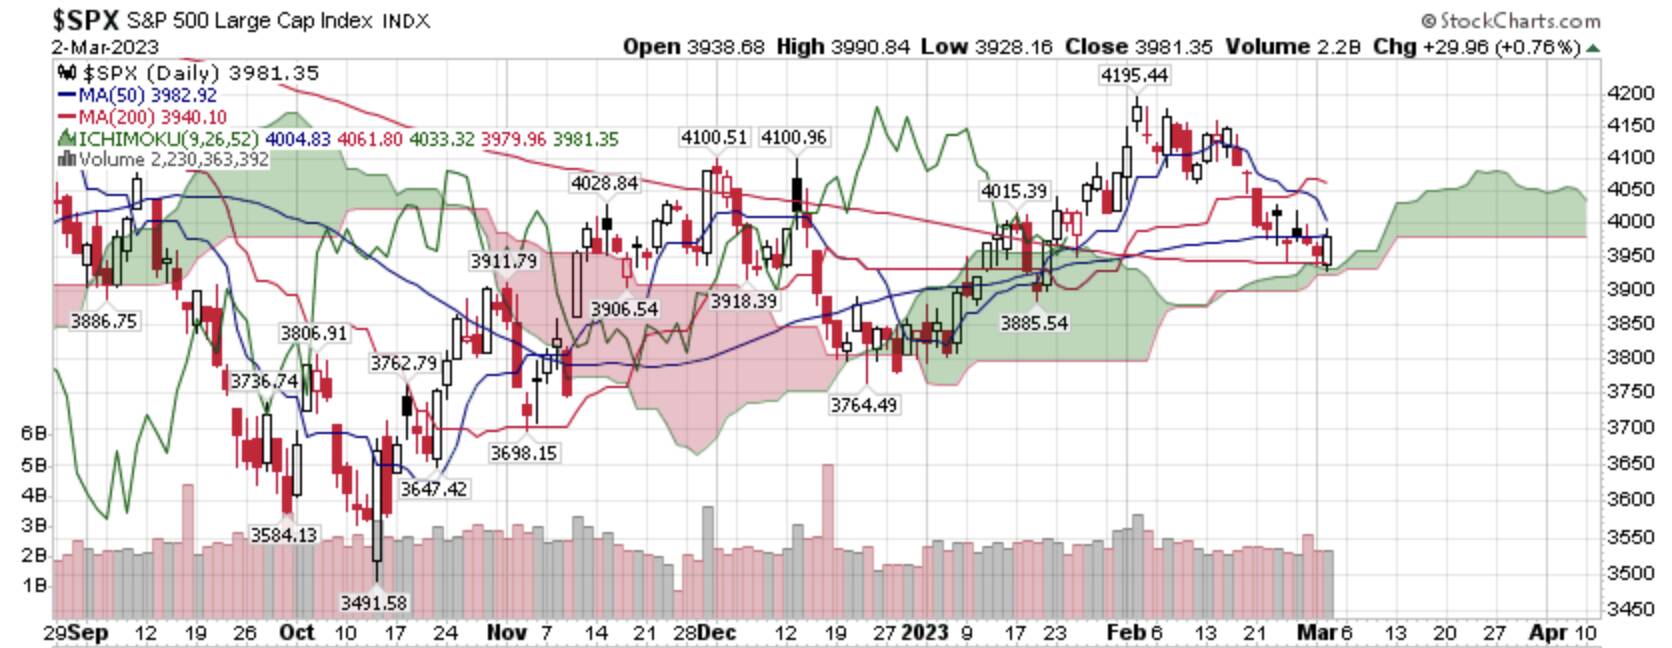
Below is the updated 2h chart by Mauro.
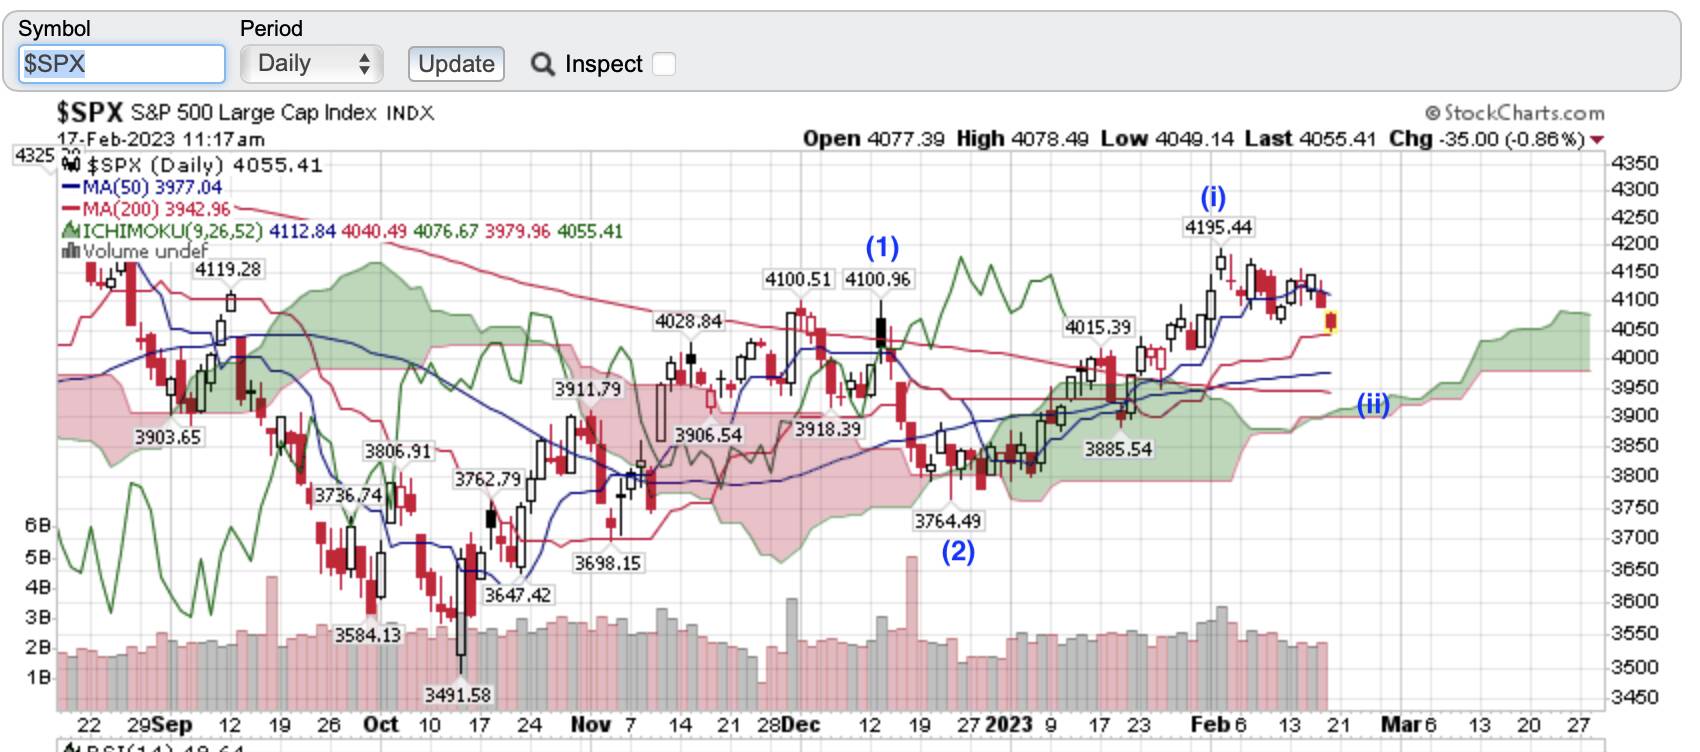
He keeps mixing 2h, h, daily, weekly charts, can be quite confusing, so I post a daily chart…
Roaring 20s roadmap. Covid 2020 crash was like 1987 (the 7-year itch) and the bear market in 2022 was like 1990. We are taking off this year and there are 6 or more years of secular bull market ahead of us.
![]()

Interesting chart that helped me understand secular bear and bull market terminology. I didn’t know 2000-2013 was secular bear.
Can not be!
Yield curve inversion was stronger and longer than 2000 and 2008. This means very strong bearish wave occurs ( no soft landing at all ).
Before market goes to recession, yield curve comes to normal mode from inversion. That is the indication for recession.
See WB he sold most of the stocks ( net sold ) and holding cash. His selling of TSM 4B is in line with my algorithmic indication that Semi’s are going to hit hard this time.
There is no bull wave without a recession.
[edit] It only matters for those B&H, but for traders like me it does not matter as I will be with cash when it dips. Identifying TOP (DTK) is not in an issue, but finding the bottom (FTB) is really challenge, but doable with certain 5%-10% risk.
He added to AAPL ![]()
Too hard. I have given up.
We bounce or we keep going lower. How’s that for being decisive? ![]()
?
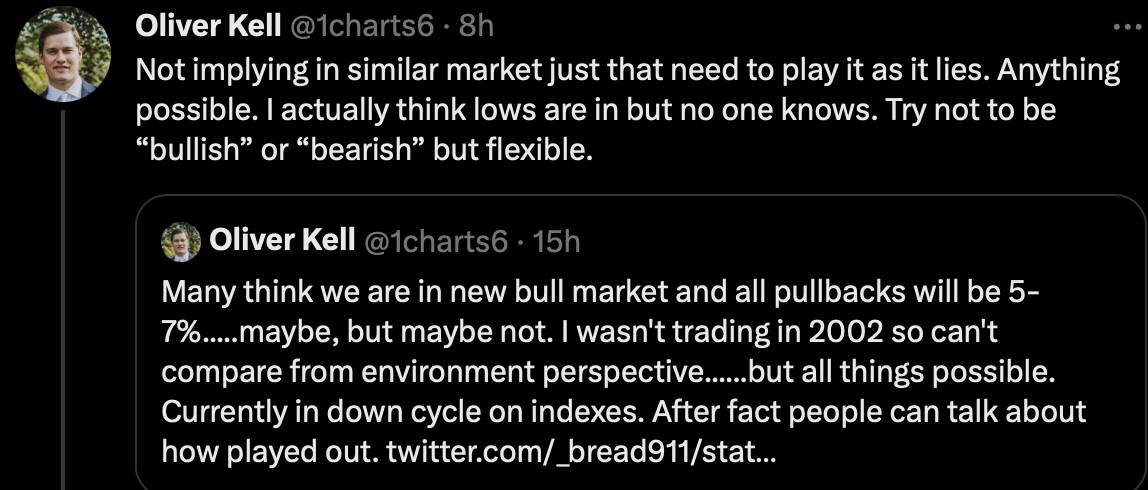
Is a bull market but be willing to change your mind in a dime if price action indicates you’re wrong.
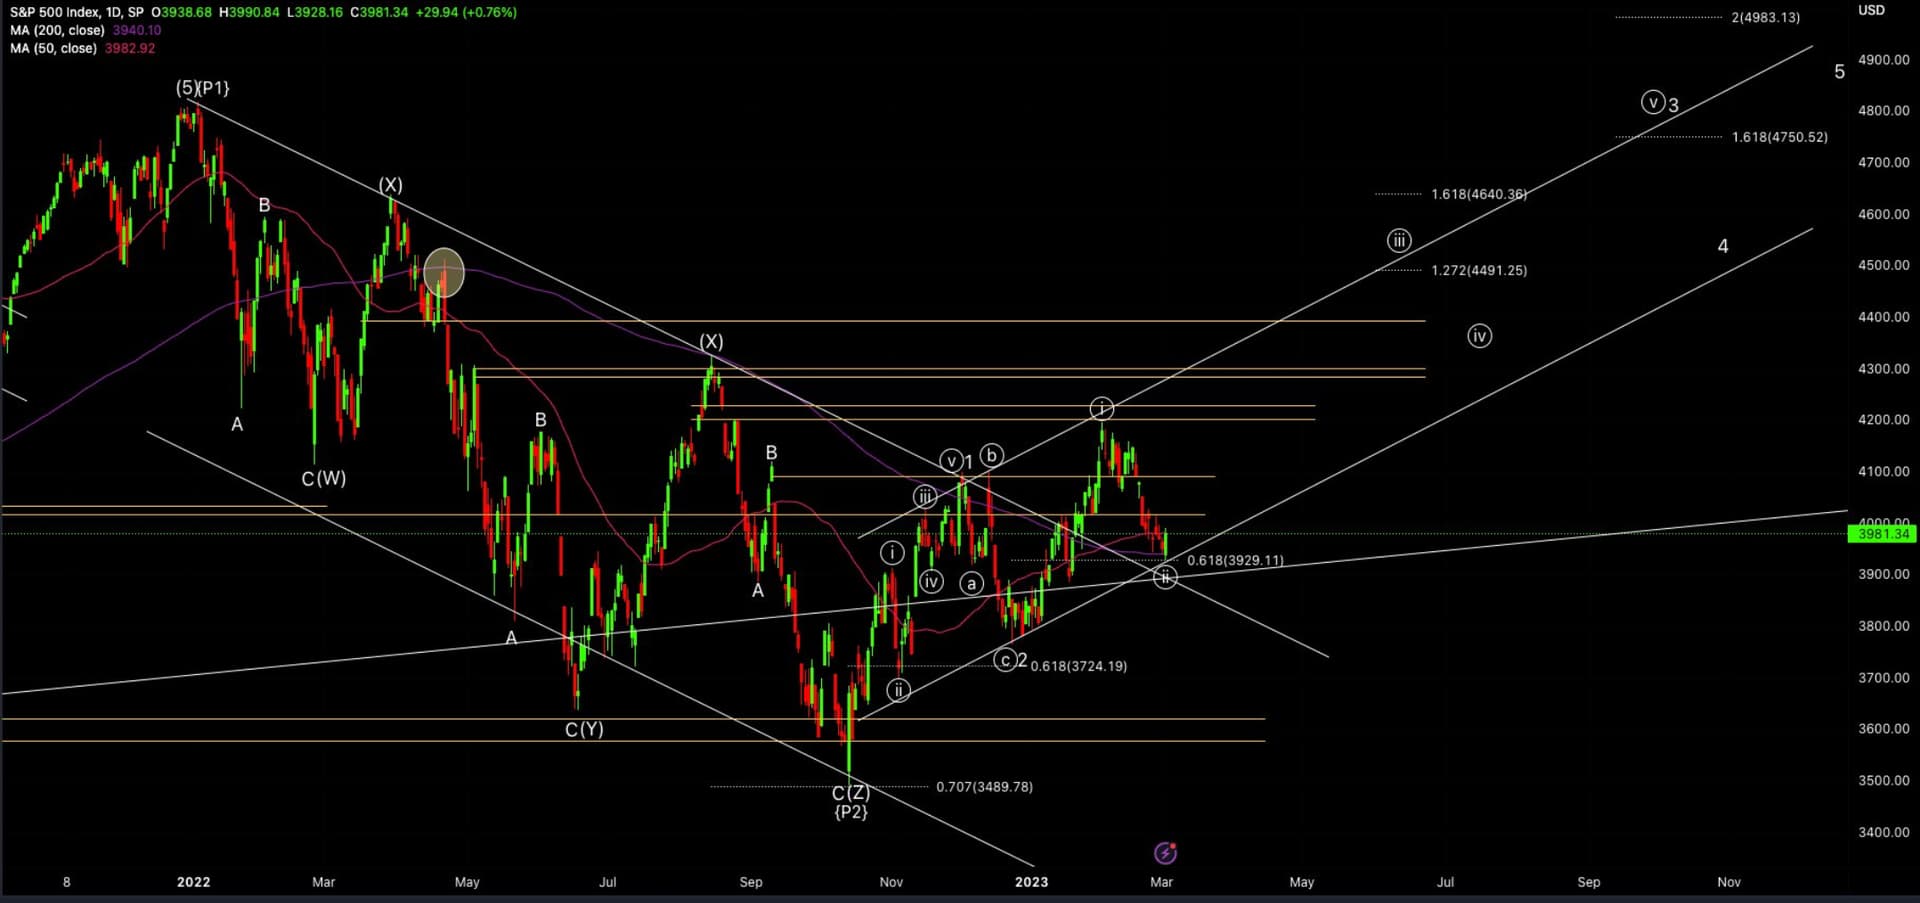
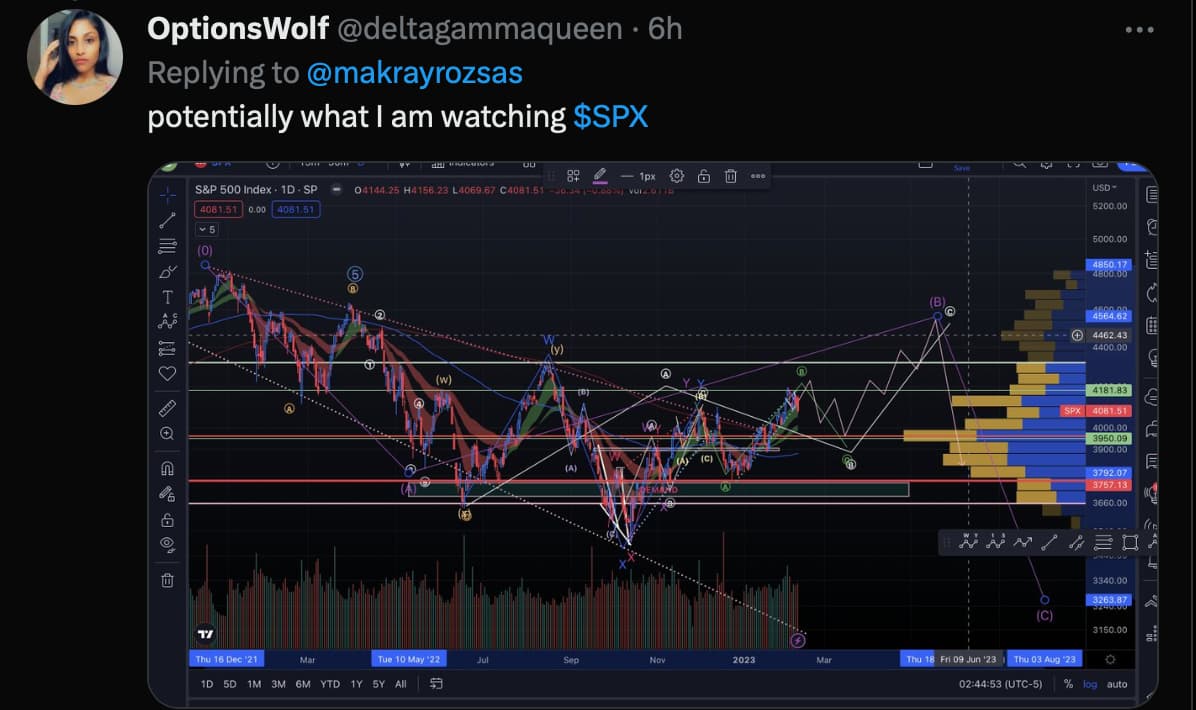
A bullish EW count for SPX. Bullish theory is…
…possibly wrong if below 3885.
…definitely wrong below 3725.
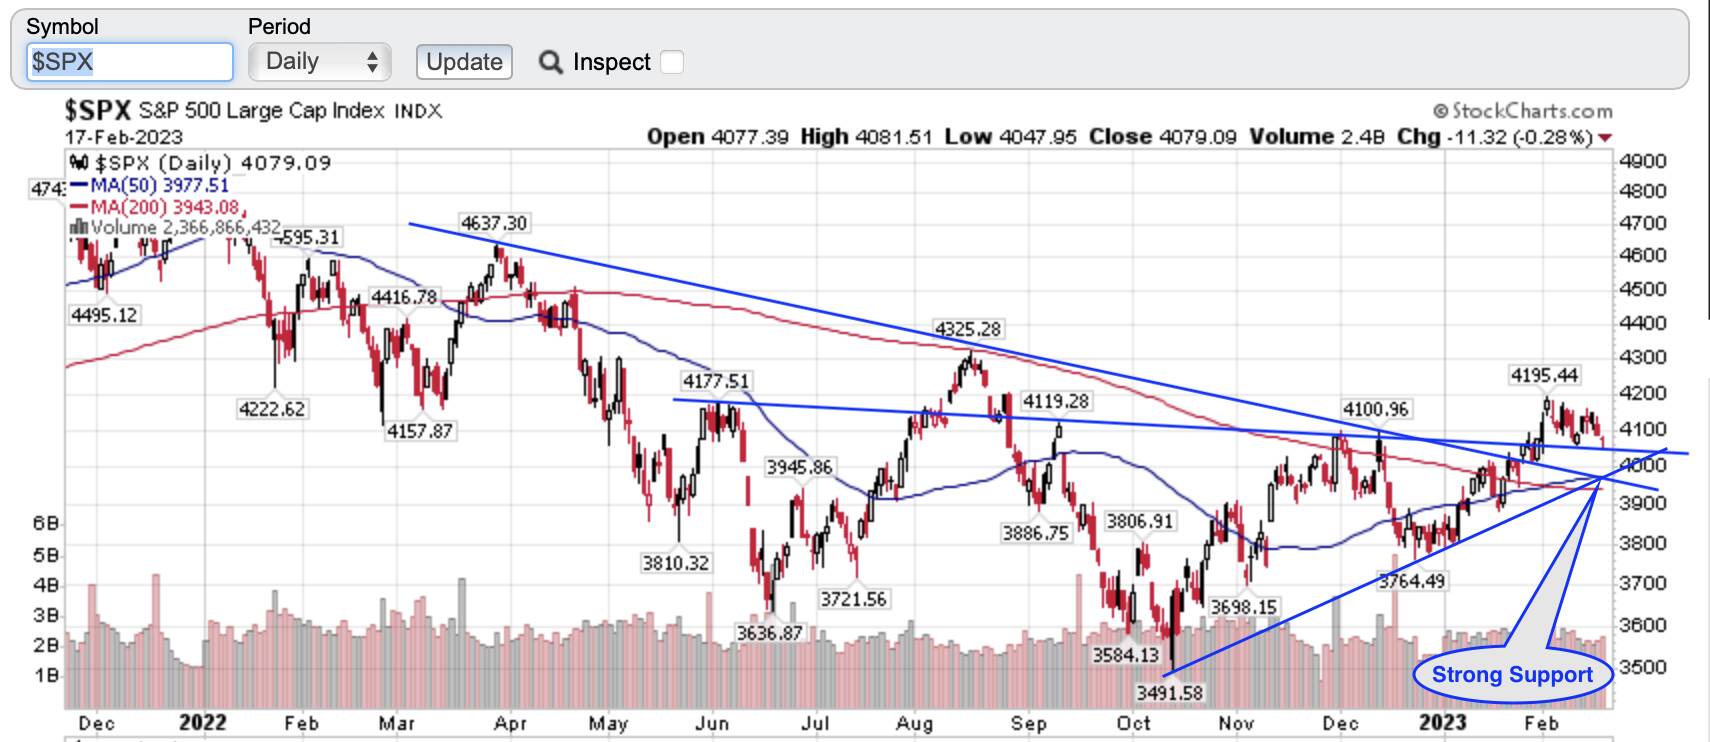
So far, bounce up from 200-day SMA but resisted by 50-day SMA. Direction is thus unclear.